
Octo's BlogGuide · Benchmarking
How to benchmark a pharmacy against its peers
Benchmarking shows where a pharmacy sits among comparable pharmacies in its own nation, measure by measure, from published NHS data. This guide walks through it in seven steps with a worked example, from choosing the right comparison to finding the gaps worth closing.
Written by Octo · Signed off by a pharmacist
7 November 2026 · Data: the latest published months for each nation (Scotland's services and most payments are published quarterly)
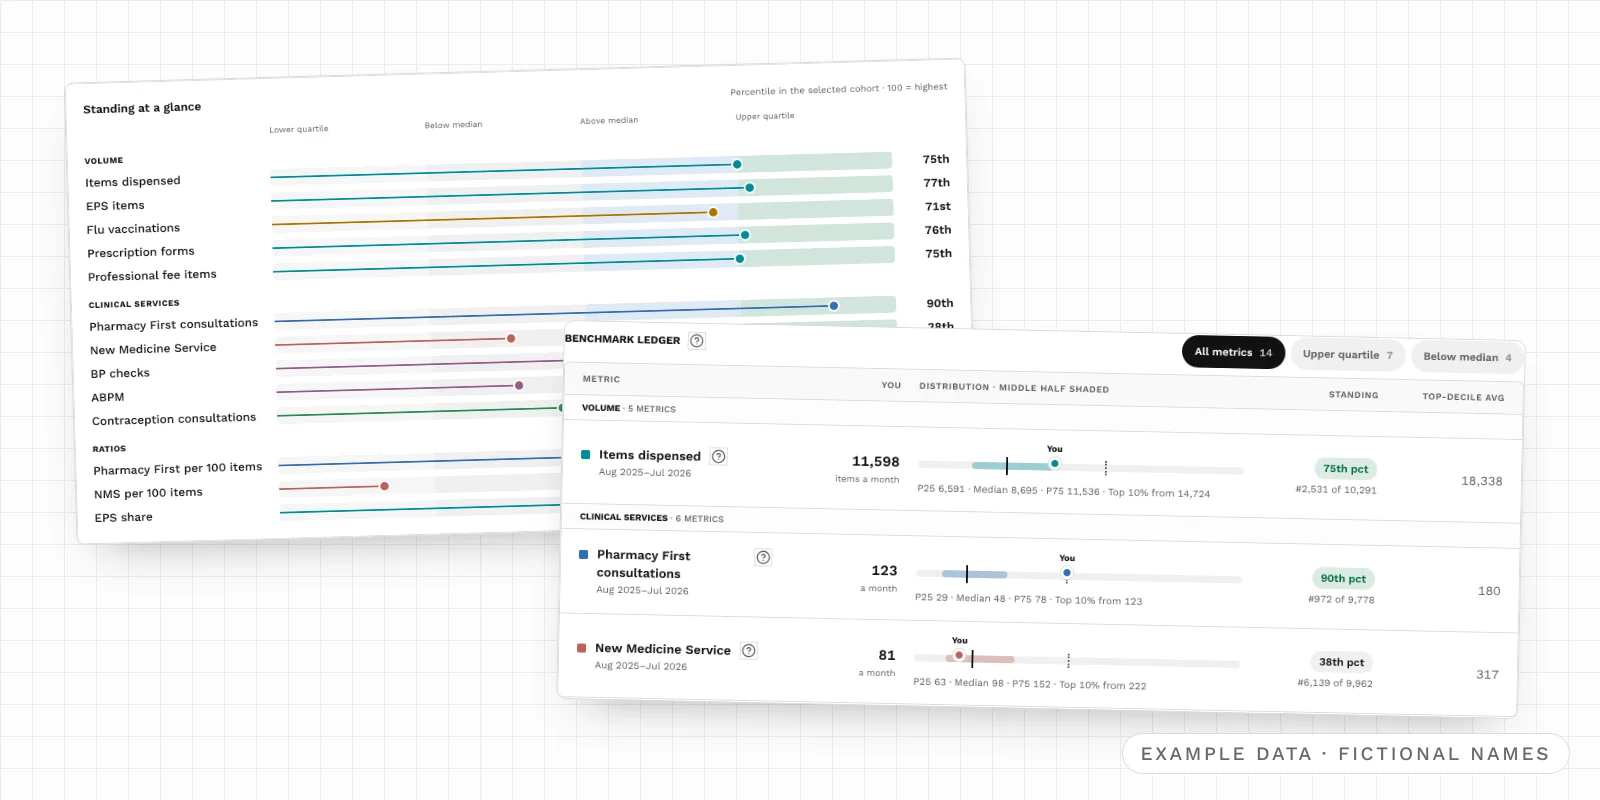
What is pharmacy benchmarking?
Pharmacy benchmarking means comparing one pharmacy's activity with that of similar pharmacies, so you can see what is normal, where it stands out and where it falls behind. A raw figure, such as 120 Pharmacy First consultations a month, means little on its own. Set against every other pharmacy in the same nation, it becomes a position: ahead of nine in ten, or behind most.
Pharmacy8's Benchmarking page does this from the figures each nation's NHS publishes for every pharmacy. For each measure it shows:
- the pharmacy's average a month over the window you choose
- its percentile and rank in the comparison group
- the spread of the group, with its middle half and median marked
- the average of the group's busiest tenth
It is useful whether you own the pharmacy, are thinking of buying it, advise or lend to its owner, or run a group and want to see each branch in context.
The worked example
The screens use one fictional pharmacy: Example Pharmacy, in the made-up town of Exampleton in England. It is the same pharmacy as in our guide to GP feeder surgeries. All names and figures are invented, and each screen is labelled as example data. Numbered markers on the screens match the numbers in the text. By the end, the example tells this story:
- Items dispensed
- 75th
- percentile, all English pharmacies
- Pharmacy First
- 90th
- percentile, consultations a month
- NMS per 100 items
- 17th
- percentile, the clearest gap
- Items, similar size
- 93rd
- percentile, 7,500–12,000 items a month
Before you start
- Who can use it: Benchmarking is included with Octo. On a free account, the page opens with illustrative peers so you can try every control before you subscribe.
- Nations are never mixed: an English pharmacy is compared only with English pharmacies, a Scottish one with Scottish pharmacies, and so on. Each nation publishes different measures, so each benchmarks different things:
| Nation | What is benchmarked | Regional comparison |
|---|---|---|
| England | Items, EPS items and share, forms, fee items, flu, Pharmacy First, New Medicine Service, blood pressure checks, ABPM, contraception and smoking cessation | By ICB |
| Scotland | Items, Pharmacy First, Medicines: Care and Review, methadone, emergency contraception, smoking cessation, and the payments PHS publishes | By health board |
| Wales | Items, forms, fee items, the Common Ailments Service and smoking cessation | By health board |
| Northern Ireland | Items | Not available |
- Payments are Scotland only. NHSBSA, NWSSP and HSCNI BSO do not publish what each pharmacy is paid, so England, Wales and Northern Ireland have no payment benchmarks. Pharmacy8 does not estimate them.
- How fresh it is: each nation's figures run to its own latest published month. In Scotland, services and most payments are published quarterly, so they are compared over their own window, which can end a few months before items.
Step 1: Choose the pharmacy
Open Benchmarking from the menu. It starts with the pharmacy you last viewed, or the default pharmacy in your settings.
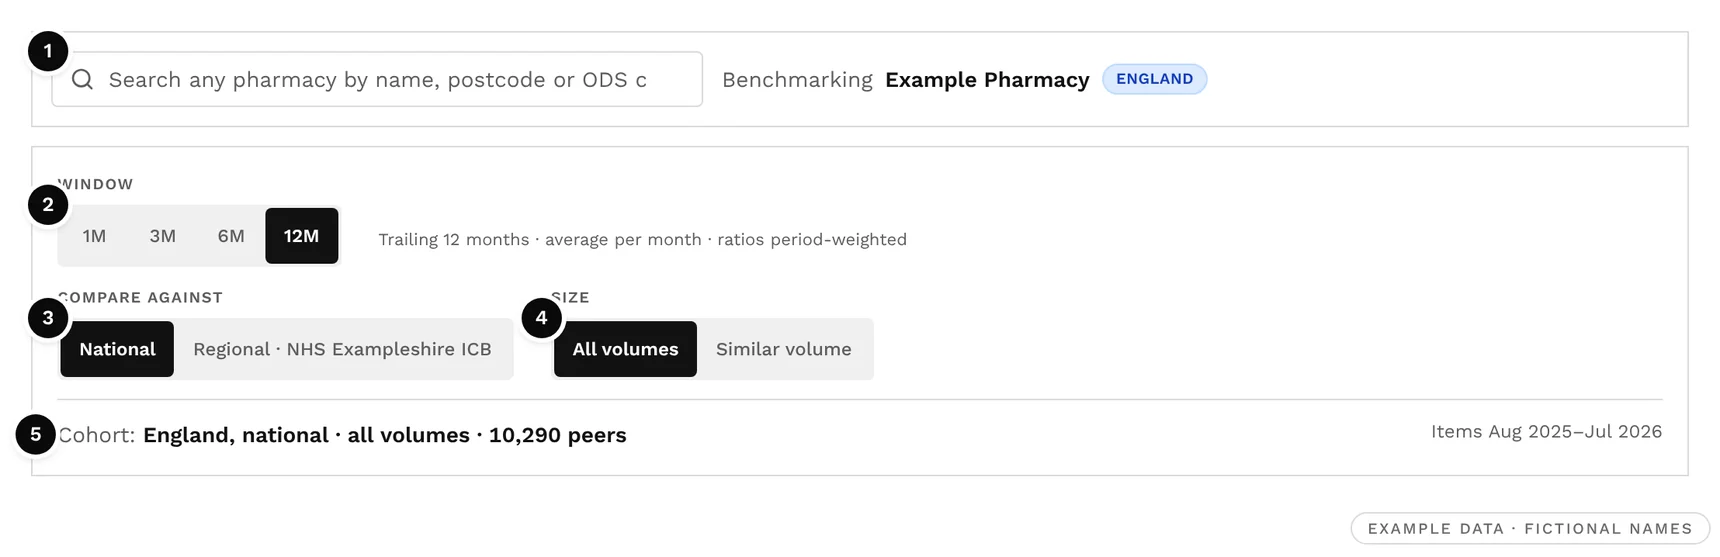
- ❶ Search by name, postcode or ODS code to benchmark any other pharmacy. Reset to my pharmacy takes you back.
Step 2: Set the window to 12 months
The page opens on the latest month (1M). Choose 3M, 6M or 12M ❷ to compare over a longer window. Every figure is an average per month over the window, and ratios such as Pharmacy First per 100 items are worked out from the window's totals.
A month a pharmacy has not yet reported is left out of its average, never counted as zero.
Step 3: Choose who to compare against
Two controls decide the cohort, the group of pharmacies the figures are compared with:
- ❸ Compare against: National uses every pharmacy in the same nation. Regional narrows it to the pharmacy's ICB in England, or its health board in Scotland and Wales. Northern Ireland has no regional option, because no region is published for its pharmacies.
- ❹ Size: All volumes, or Similar volume, which keeps only pharmacies in the same size band by average items a month: under 4,000; 4,000 to 7,500; 7,500 to 12,000; or 12,000 and over.
The cohort line ❺ always says who is in the comparison and how many pharmacies that is. Changing either control recalculates the page at once.
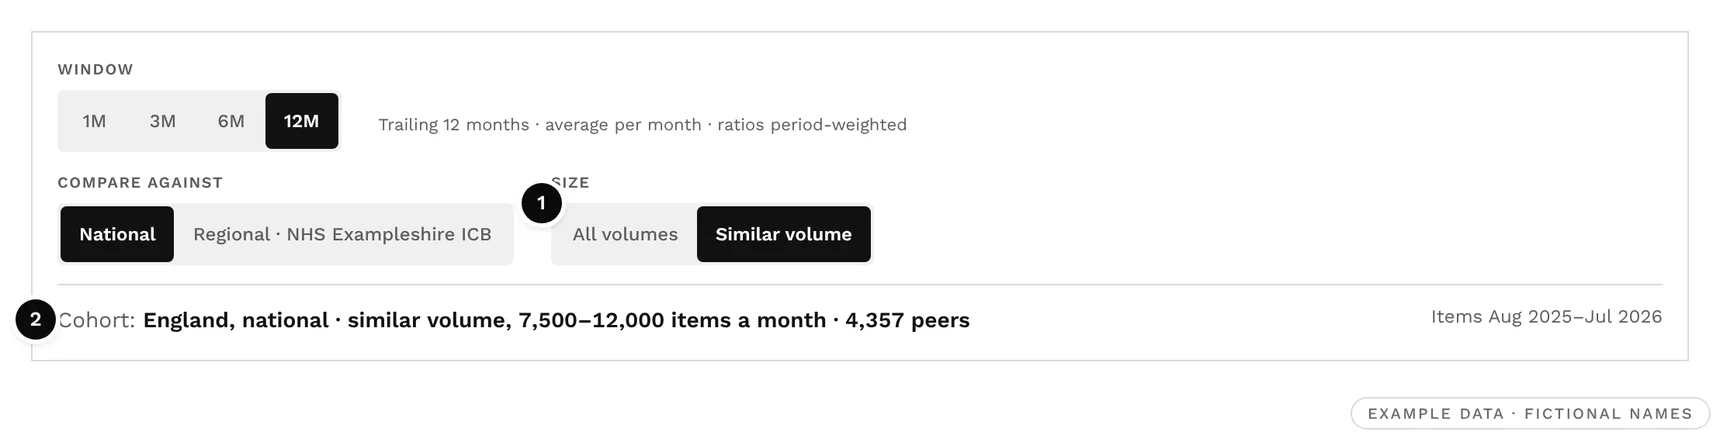
The same pharmacy can look quite different depending on the cohort:
| Cohort | Peers | Items | Pharmacy First | New Medicine Service |
|---|---|---|---|---|
| England, all volumes | 10,290 | 75th | 90th | 38th |
| NHS Exampleshire ICB | 236 | 77th | 89th | 41st |
| England, 7,500–12,000 items | 4,357 | 93rd | 92nd | 29th |
Among pharmacies of its own size, Example Pharmacy's items rank higher, because it sits near the top of its band. Its New Medicine Service ranking falls, because similar-sized pharmacies tend to deliver more NMS than smaller ones.
Step 4: Read the standing at a glance
Standing at a glance puts every ranked measure on one chart. Each row is a track from 0 to 100, split into quartiles, with a dot at the pharmacy's percentile.
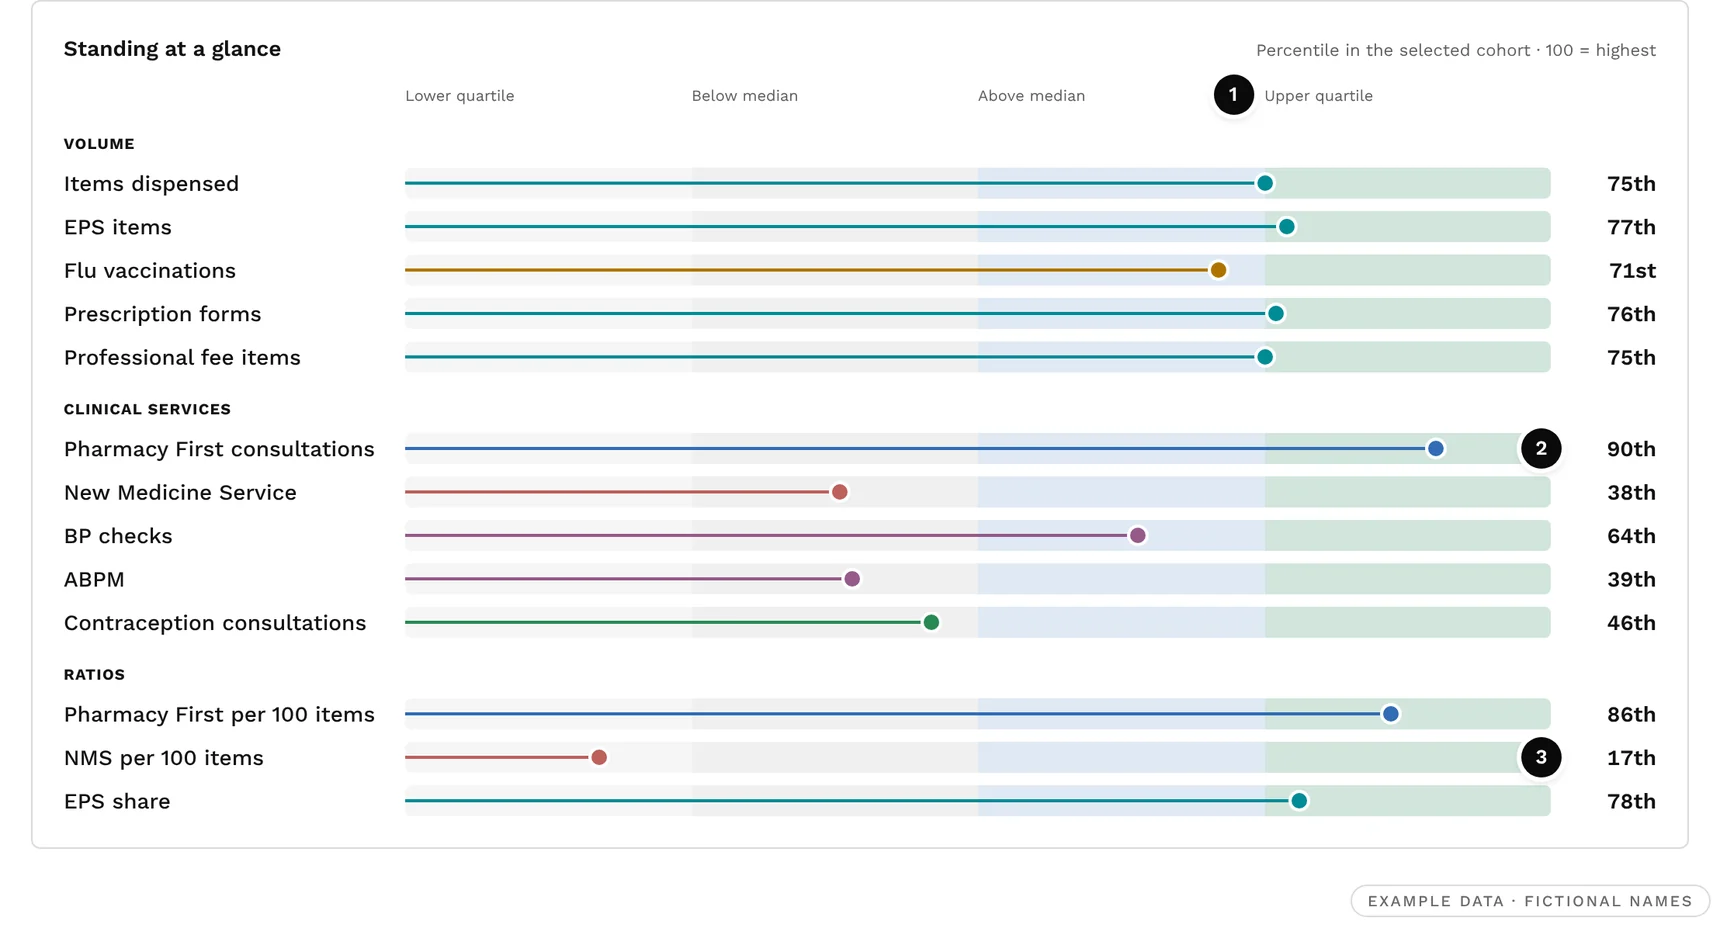
The track is split into the four quarters of the cohort. The ledger and its filters use three standings:
| Standing | Percentile |
|---|---|
| Upper quartile | 75th and above |
| Above median | 50th to 74th |
| Below median | under 50th |
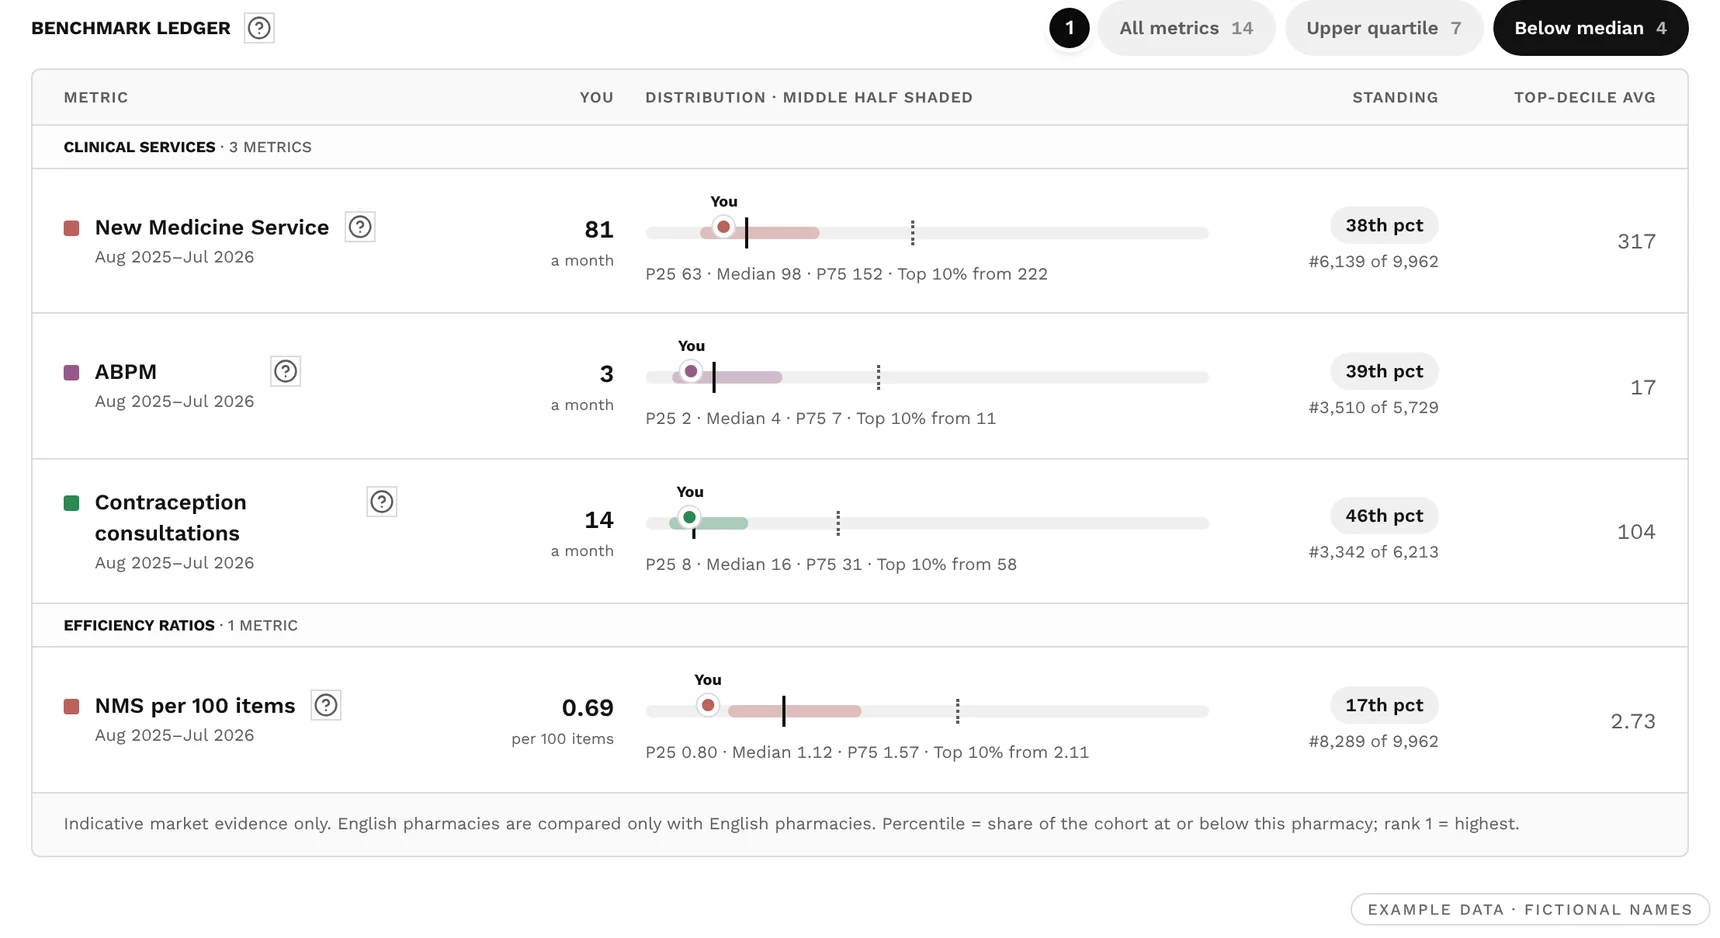
In the example, Example Pharmacy's volume measures sit between the 71st and 77th percentiles, and Pharmacy First stands out at the 90th ❷. But New Medicine Service per 100 items is down at the 17th ❸: for every 100 items it dispenses, it delivers fewer NMS consultations than more than four in five English pharmacies.
Filter to the gaps
Above the ledger, the All metrics, Upper quartile and Below median filters ❶ show only the measures in that standing, with a count on each.
Step 5: Read a row of the ledger
The Benchmark ledger gives every measure a row, grouped into volume, clinical services, payments (Scotland only) and ratios.
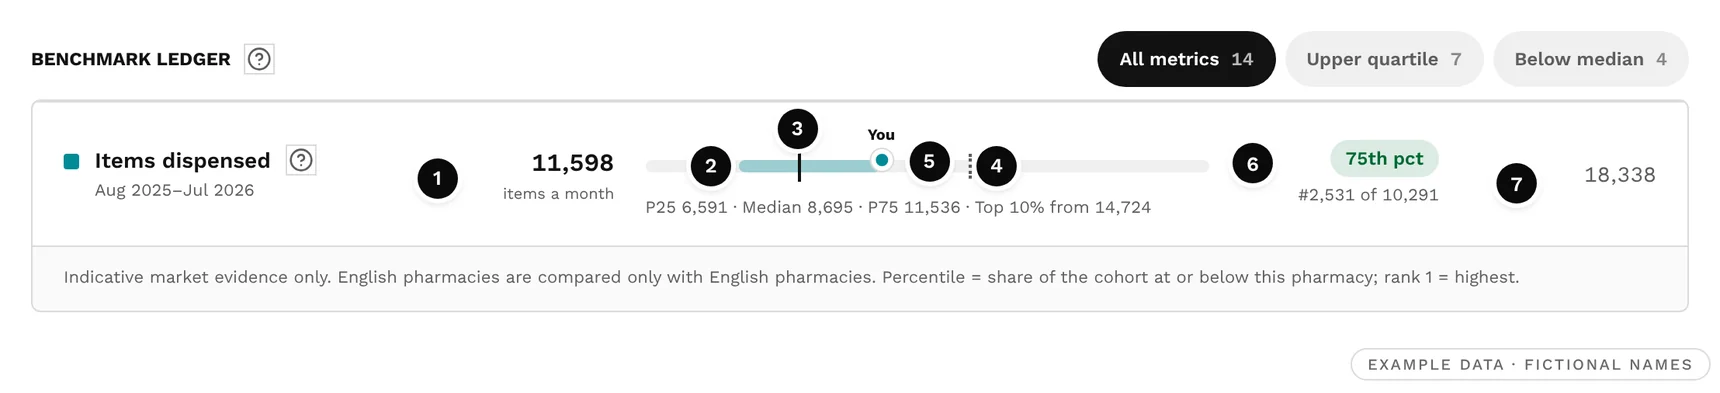
- You: the pharmacy's average a month. Example Pharmacy dispensed 11,598 items a month.
- The middle half, shaded: from the 25th to the 75th percentile of the cohort (6,591 to 11,536 items).
- The median, the solid line: the middle pharmacy (8,695 items).
- The top 10%, the dotted line: the figure the busiest tenth start from (14,724 items). It appears only when at least 40 pharmacies deliver the measure.
- Your marker, labelled You. The strip runs from the cohort's 1st to its 99th percentile; a pharmacy outside that range is pinned to the edge with an arrow.
- Standing: the percentile and the rank. Example Pharmacy is at the 75th percentile, ranked 2,531st of 10,291. The rank counts the pharmacy itself, so it is one more than the peers on the cohort line.
- Top-decile average: the average of the busiest tenth (18,338 items), a realistic ceiling for the measure.
Select the ? beside a measure for what it counts.
When a measure is not ranked
- Not delivered: if the pharmacy has no activity for a service in the window, it reads Not delivered and is not ranked. Pharmacies that do not deliver a service are left out of that service's ranking altogether, so a service is only ever compared among pharmacies that offer it. In the example, smoking cessation is not delivered.
- Cohort too small: a measure needs at least 20 pharmacies delivering it to be ranked. With fewer, it says how many there are; try a wider cohort.
- Not enough published activity: flu vaccinations are seasonal, so in a short window outside the season there may be too little to rank.
Volume measures, such as items, rank every pharmacy with a published month. At the foot of the ledger, Further ledger measures lists extra figures, such as NMS cap use in England, that are shown but not ranked.
Step 6: Check the related evidence
Under the ledger, Related evidence for this pharmacy adds three short cards, each linking to the full analysis.
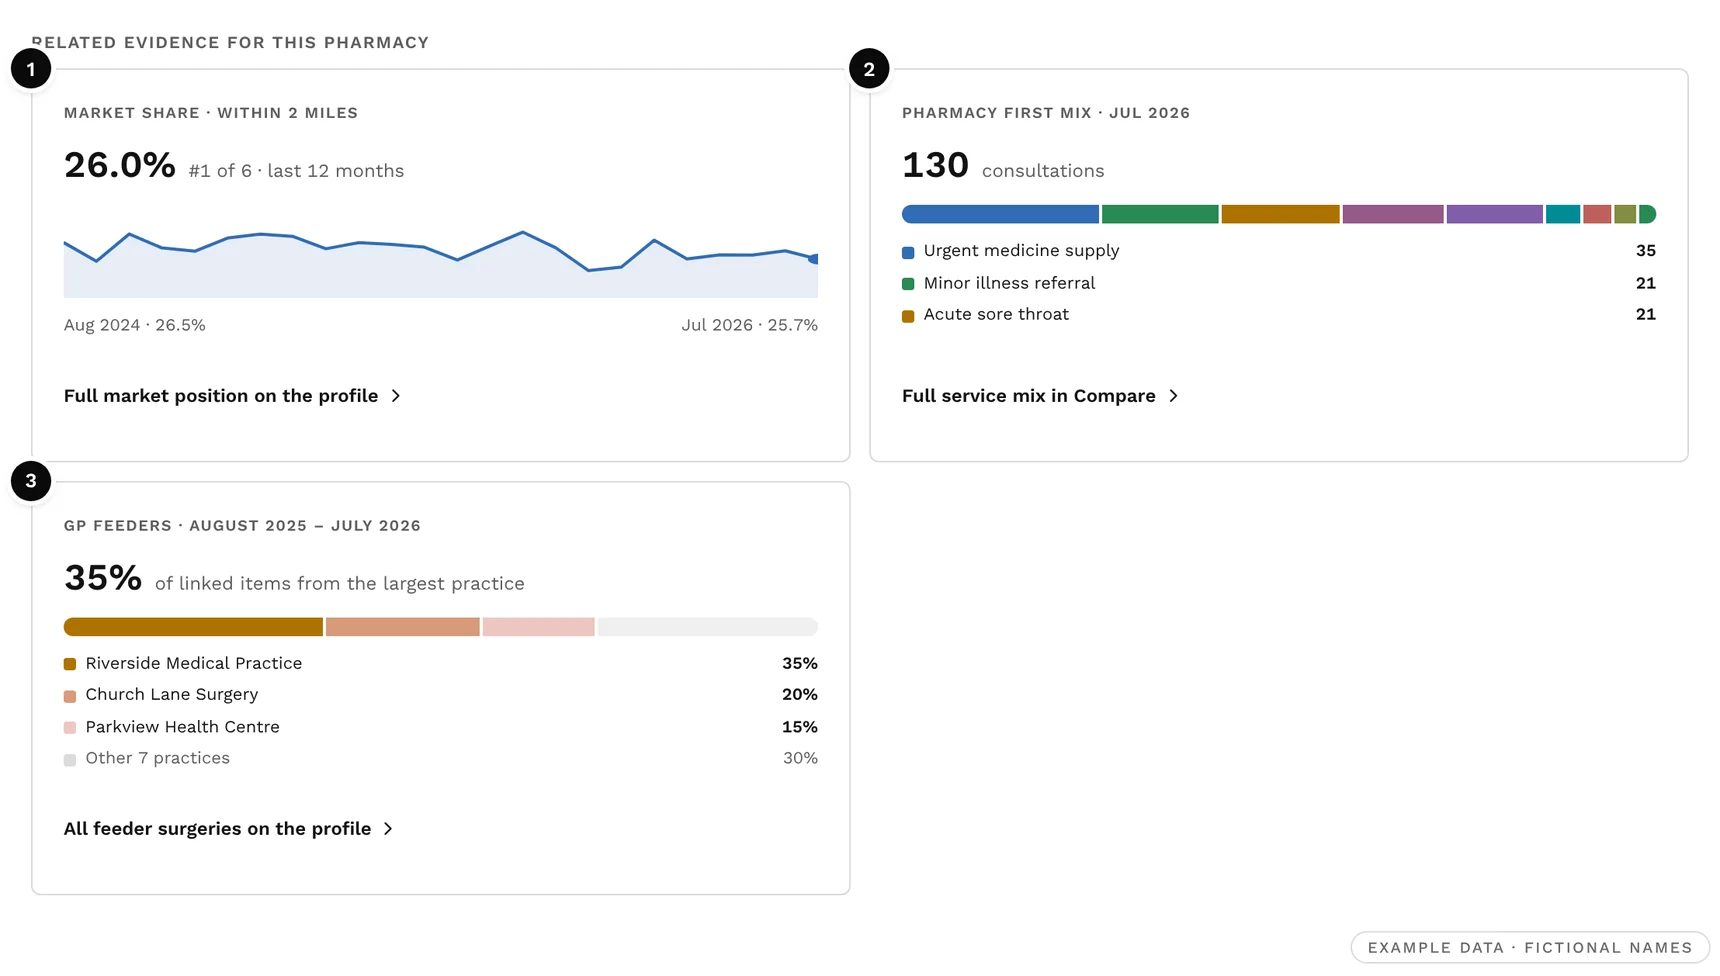
- ❶ Market share within 2 miles: the pharmacy's share of items among pharmacies in the same nation within 2 miles over the last 12 months, its rank among them, and its monthly share over two years. Example Pharmacy has 26.0%, the largest of six, but its share has drifted down from 26.5% to 25.7%.
- ❷ Pharmacy First mix (England and Scotland): the latest month's consultations by condition. In Scotland, it also shows how consultations ended: a supply, a consultation only or a GP referral.
- ❸ GP feeders: the share of the pharmacy's GP-linked items from its three largest surgeries over the latest 12 months. Our GP feeder guide shows how to take this further, and why Example Pharmacy's share is slipping.
Step 7: Turn the gaps into actions
- Ask Octo for commentary. At the foot of the page, Generate commentary writes a short briefing on the pharmacy's volumes, services and standing. It is the same Performance Review as on the pharmacy's Octo Insights tab. In England and Scotland it can put a £ figure on a service's gap to the national peer average, worked out from published fees or payments; in Wales and Northern Ireland it reports the gap alone. Each commentary uses one of your 15 monthly Octo analyses, and nothing runs until you ask.
- Compare. Put the pharmacy beside up to four others for the full service mix.
- Diligence Report. For a purchase or a loan, set the benchmarks beside 12- and 24-month trends, GP reliance and local competitors, then export to PDF.
- Group Estate. See every branch of a group side by side.
In the example, the plan writes itself: Example Pharmacy already does well on Pharmacy First, so the clearest opportunity is the New Medicine Service, where it is in the lower half nationally and lower still among pharmacies of its size.
Read the figures carefully
- Indicative, not audited. These are the figures the NHS publishes for each pharmacy, not its own records.
- Same nation only. A pharmacy is never compared with another nation's pharmacies.
- Averages over published months. A month not yet published is left out, never counted as zero.
- Activity, not income. Outside Scotland, no payment figures are published per pharmacy, so benchmarks measure activity only.
- Scotland's services lag. They and most payments are published quarterly, and compared over their own window.
- Wales's Pharmacy First is the Common Ailments Service, and is labelled so.
The methodology sets out how percentiles, ranks and cohorts are worked out.
Frequently asked questions
What is pharmacy benchmarking?
Comparing a pharmacy's activity, such as items dispensed or Pharmacy First consultations, with similar pharmacies in the same nation, to see where it is ahead, typical or behind.
How many items does the average pharmacy dispense a month?
In July 2026, the average high-street pharmacy in England dispensed 9,878 items, according to Pharmacy8's analysis of NHSBSA data in our July 2026 roundup. NHSBSA's annual figures put the average at 104,000 items a pharmacy in 2024/25, about 8,700 a month. Benchmarking shows where any one pharmacy sits against that.
What is a good percentile for a pharmacy?
The 75th percentile or above puts a pharmacy in the upper quartile: it matches or beats three in four of its cohort. Below the 50th, it is in the lower half. What counts as good depends on the measure and on the cohort, which is why comparing with pharmacies of a similar size helps.
Why is my pharmacy not ranked for a service?
Either it has no published activity for that service in the window (Not delivered), or fewer than 20 pharmacies in the cohort deliver it. Try a longer window or a wider cohort.
Can I compare a pharmacy only with pharmacies of a similar size?
Yes. Choose Similar volume to keep only pharmacies in the same band of items a month: under 4,000; 4,000 to 7,500; 7,500 to 12,000; or 12,000 and over.
Can I benchmark NHS payments?
Only in Scotland, where Public Health Scotland publishes payments for each pharmacy. NHSBSA in England, NWSSP in Wales and HSCNI BSO in Northern Ireland do not, so Pharmacy8 benchmarks activity there.
How up to date is it?
Each nation's figures run to its latest published month, usually a few months behind. Scotland's services and most payments are published quarterly. The window label on each row shows the exact months.
A quick checklist
- Set the window to 12 months.
- Read the national standing at a glance.
- Filter to Below median to list the gaps.
- Switch to Similar volume to check them against pharmacies of the same size.
- Check regional, to see the local picture.
- Read the related evidence, then generate Octo's commentary.
Sources
- 1.NHSBSA, Pharmacy and Appliance Contractor Dispensing Data
- 2.NHSBSA, General Pharmaceutical Services in England
- 3.The Pharmaceutical Journal, 'Record number' of prescriptions dispensed in England in 2024/2025 despite reduction in number of pharmacies
- 4.Public Health Scotland, Community Pharmacy Contractor Activity
- 5.Public Health Scotland, Prescriptions in the Community
- 6.NHS Wales Shared Services Partnership, Pharmacy / practice dispensing data (Wales)
- 7.HSCNI Business Services Organisation, Community pharmacy dispensing (Northern Ireland)
Written by Octo, Pharmacy8's AI analyst, from the sources above and checked by a registered pharmacist before publication. Figures marked “Pharmacy8 data” are Pharmacy8's own analysis of the published datasets. Pharmacy8 is not affiliated with the publishers cited.