
Octo's BlogGuide · GP feeder surgeries
How to analyse a pharmacy's GP feeder surgeries
Most of a community pharmacy's prescriptions come from a handful of GP surgeries. This guide shows you, in seven steps with a worked example, how to find them, measure how much a pharmacy relies on each, and spot scripts moving to a competitor.
Written by Octo · Signed off by a pharmacist
5 November 2026 · Data: the latest published months for each nation (Scotland's linkage is published quarterly)
What is a GP feeder surgery?
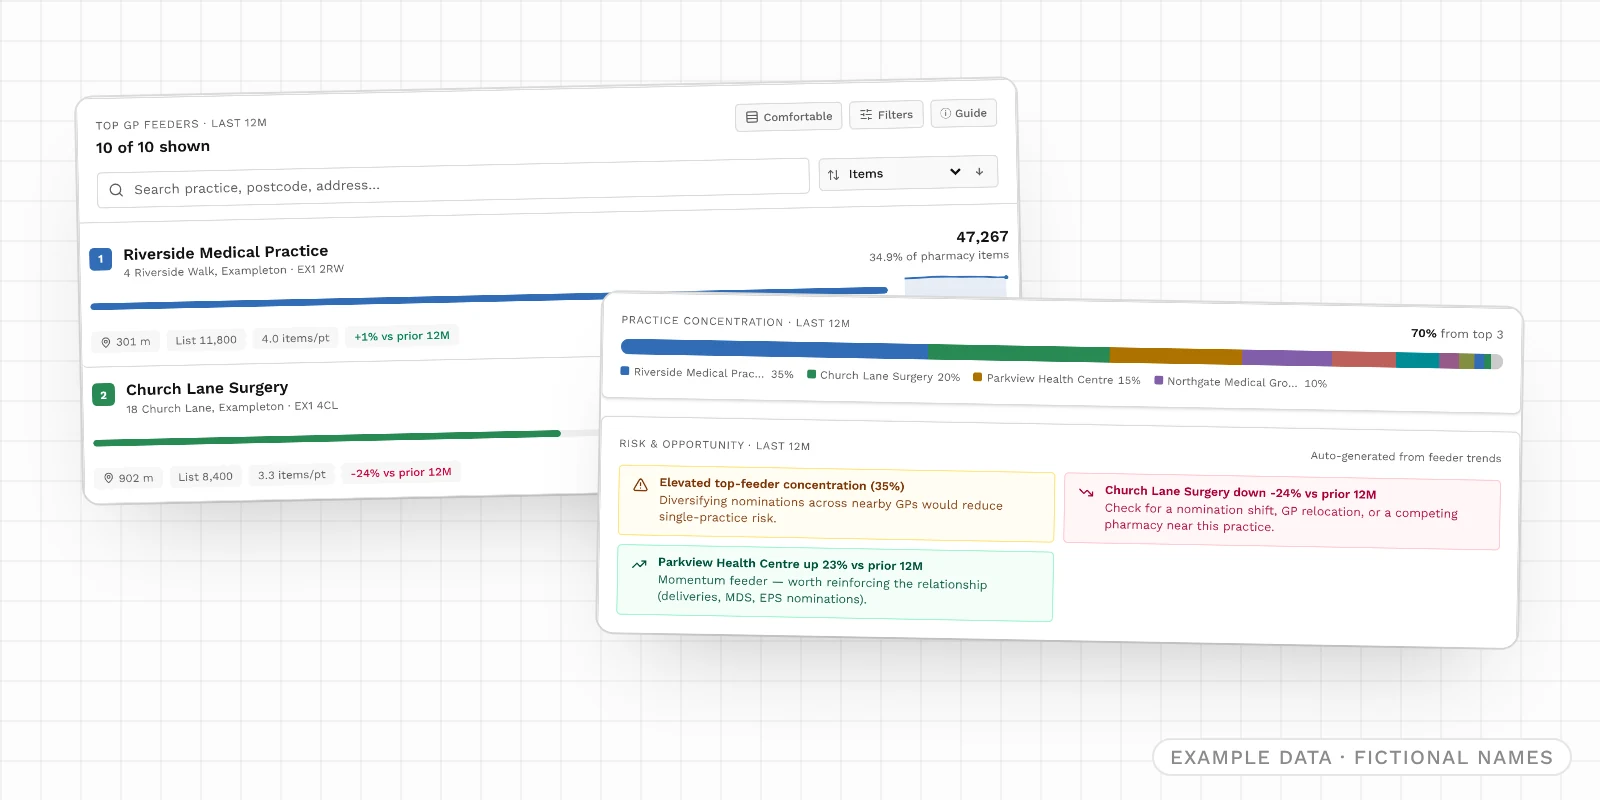
A GP feeder surgery is a GP practice whose prescriptions a pharmacy dispenses. For most community pharmacies, a few nearby surgeries account for most of their items. So when one of those surgeries merges, moves, closes its list, or gets a new pharmacy next door, the pharmacy's volumes change months later.
The NHS publishes which practice wrote each dispensed item and which pharmacy dispensed it. Pharmacy8 joins those links up so you can read them both ways:
- From the pharmacy: which surgeries feed it, and how much it depends on each one.
- From the surgery: which pharmacies its patients use, and which are gaining or losing share.
It is useful whether you own the pharmacy, are thinking of buying it, are lending against it, or are watching a competitor.
The worked example
The screens use one fictional example: Example Pharmacy, and its largest feeder, Riverside Medical Practice, in the made-up town of Exampleton. All names, codes and figures are invented, and each screen is labelled as example data. Numbered markers on the screens match the numbers in the text. By the end, the example tells this story:
- Reliance on Riverside
- 35%
- of Example Pharmacy's items
- Church Lane Surgery
- -24%
- items sent, vs the previous 12 months
- Share of Riverside
- 29.4%
- dispensed by Example Pharmacy
- Kept within a mile
- 66.2%
- of Riverside's prescriptions
Before you start
- Who can use it: every GP feeder surgery is included with Octo. On the Free plan you see the headline figures and the single largest feeder for any pharmacy you search.
- Where it covers: England, Scotland, Wales and Northern Ireland. Each nation's figures come from its own publisher and are never mixed.
- How fresh it is: England, Wales and Northern Ireland publish monthly. Scotland publishes quarterly, so its latest month can be a little older. Every panel shows the period it covers.
- Which pharmacies count: appliance contractors are left out. Distance-selling pharmacies are included, and labelled on surgery pages, because they do take items from local surgeries.
- Want to try it first? The pricing page opens a live test-drive pharmacy in Glasgow with its feeders shown in full.
Step 1: Open the pharmacy's GP feeders
Search for a pharmacy by name, postcode or ODS code, open its profile and scroll to GP scripts feeding this pharmacy.
Every figure in the section follows the time window you choose on the trend chart (Step 3): 3, 6, 12 or 24 months, or All. It opens on 12 months, which is the best place to start, and each figure is compared with the window of the same length just before it.
Step 2: Read the four headline figures
Tap the i on any tile to flip it over for a plain-English explanation.
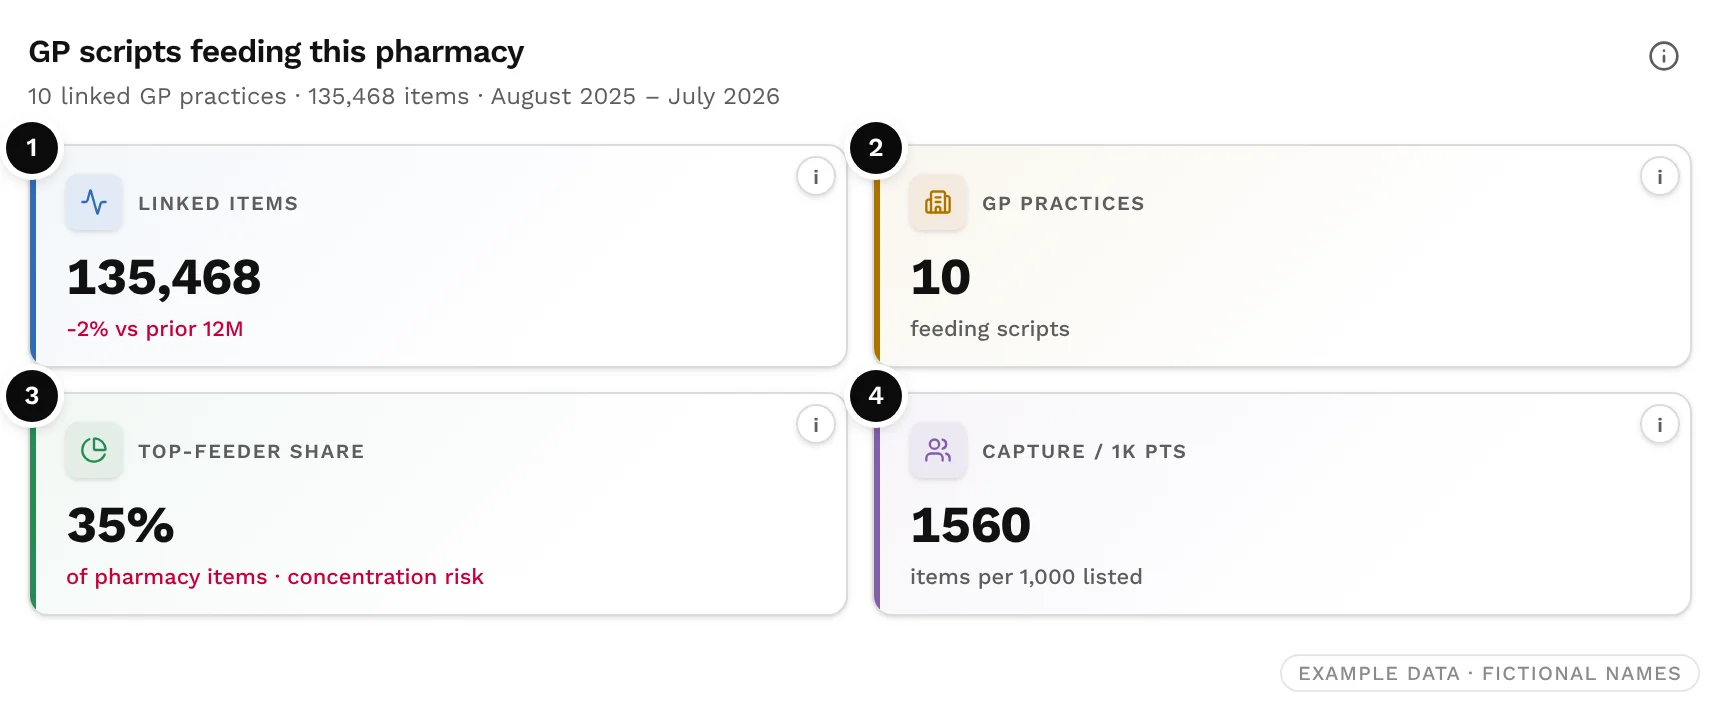
- ❶ Linked items: items dispensed against prescriptions from GP surgeries, and the change on the previous window. This is the size of the pharmacy's GP-originated business.
- ❷ GP practices: how many surgeries sent at least one prescription. More feeders usually means a more resilient prescription base.
- ❸ Top-feeder share: the share of the pharmacy's items that came from its largest surgery. Above about 30%, the pharmacy relies heavily on one practice.
- ❹ Capture / 1k pts: items from feeder surgeries per 1,000 patients on their lists. A rough measure of how well the pharmacy captures its catchment; compare like-for-like windows only.
Step 3: Check the trend
Monthly items from linked GPs plots the pharmacy's GP-originated items month by month. A rising line means it is winning more GP prescriptions; a falling line means fewer.
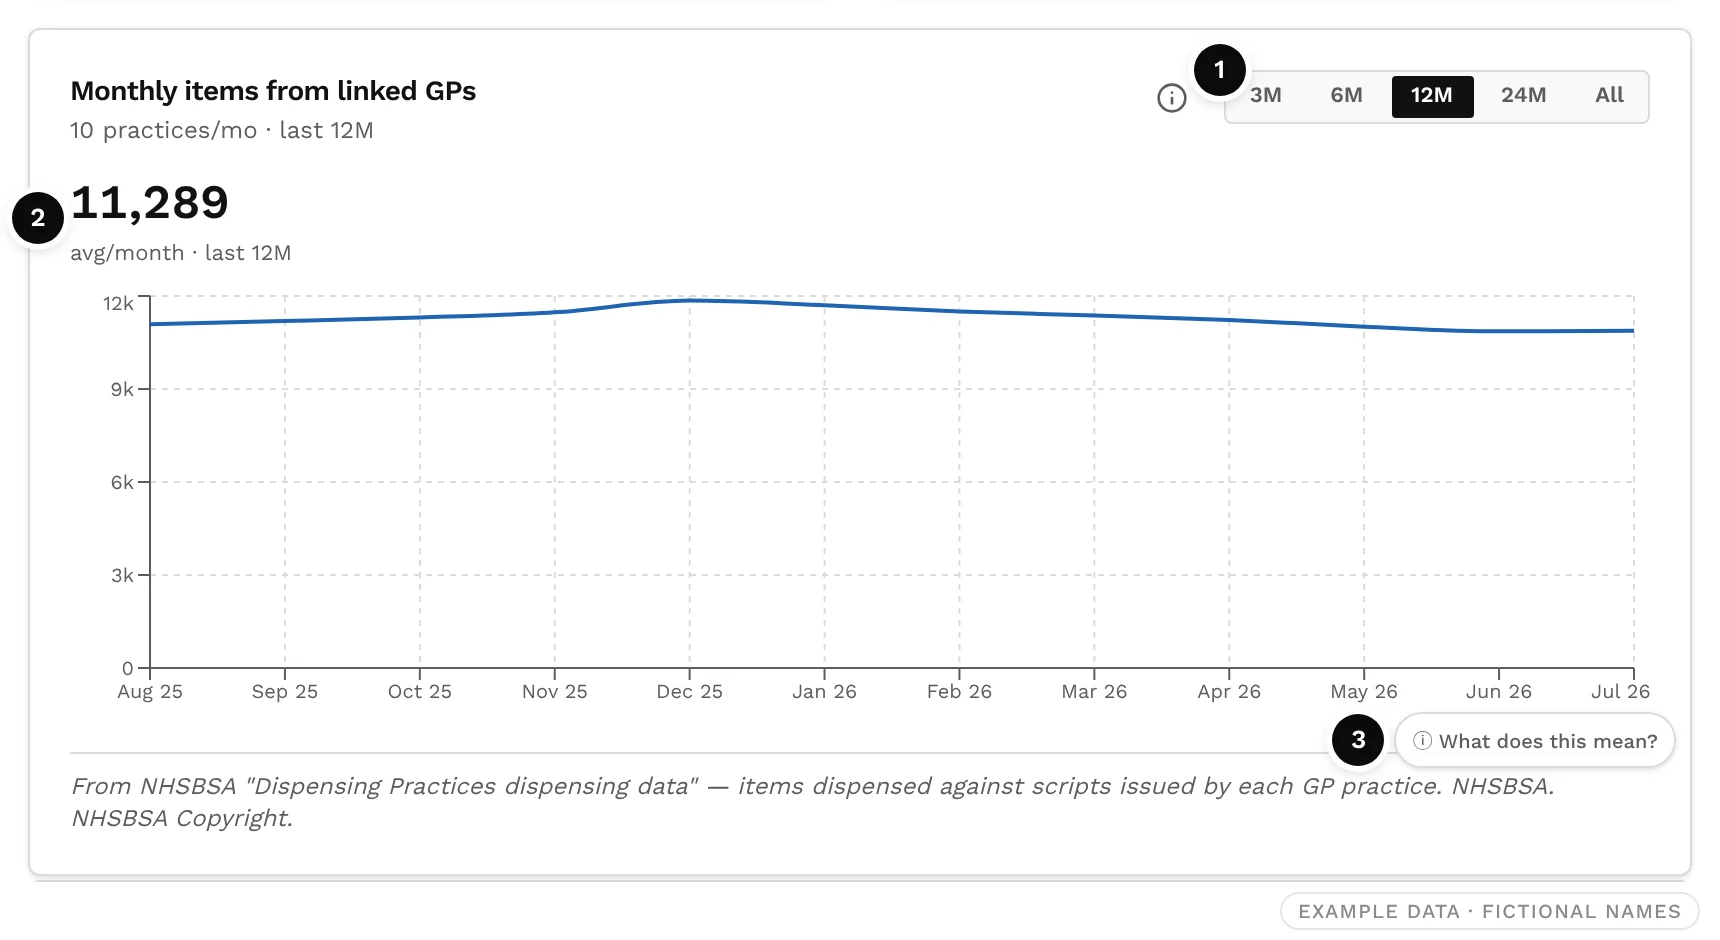
Only fully published months are drawn, and a missing month is never shown as zero.
Step 4: Read concentration and the alerts
Practice concentration splits the pharmacy's items by surgery in one bar, largest first. Risk & opportunity below it raises alerts automatically from the feeder figures.
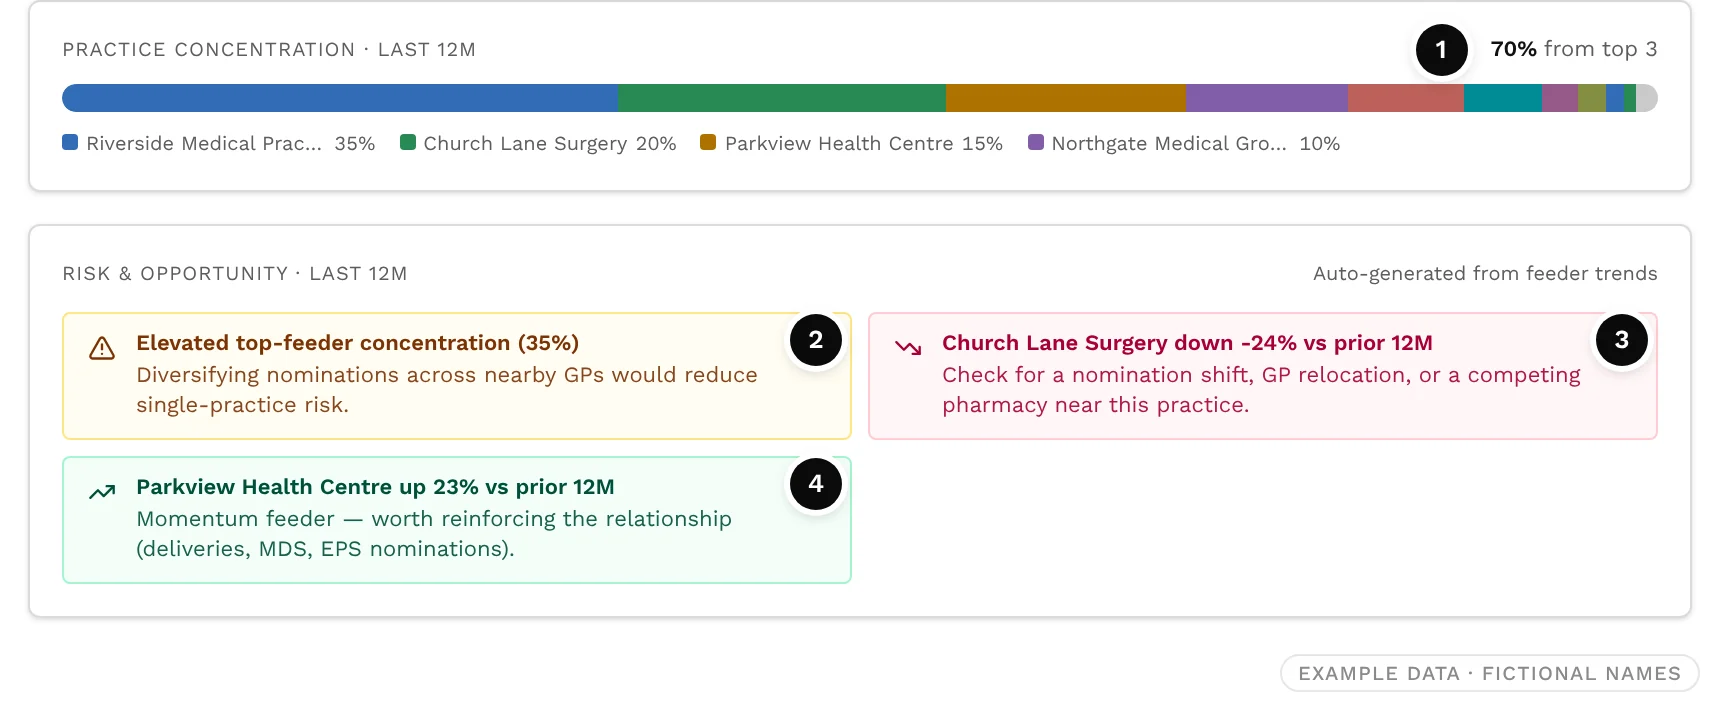
- ❶ Top-three share: the share of items from the three largest surgeries. Point at any segment of the bar for that surgery's exact share.
- ❷ Concentration alert: elevated when one surgery supplies 30% to 40% of items, high at 40% or more. When the top three supply half or less, with at least four feeders, it says the base is well diversified instead.
- ❸ A feeder down: the biggest fall, when it is 20% or more. Check for a change in nominations, a practice move, or a competitor near that surgery.
- ❹ A feeder up: the biggest rise, when it is 20% or more. A relationship worth reinforcing, for example through deliveries, multi-compartment compliance aids or EPS nominations.
The alerts are prompts, not verdicts. In the example, the obvious question is why Church Lane Surgery has fallen 24%. Step 6 answers it.
Step 5: Work through the feeder list
Top GP feeders lists every surgery that sent the pharmacy prescriptions in the window, with its items, share, change on the previous window, straight-line distance, list size and items per patient, plus a sparkline of its own monthly trend.
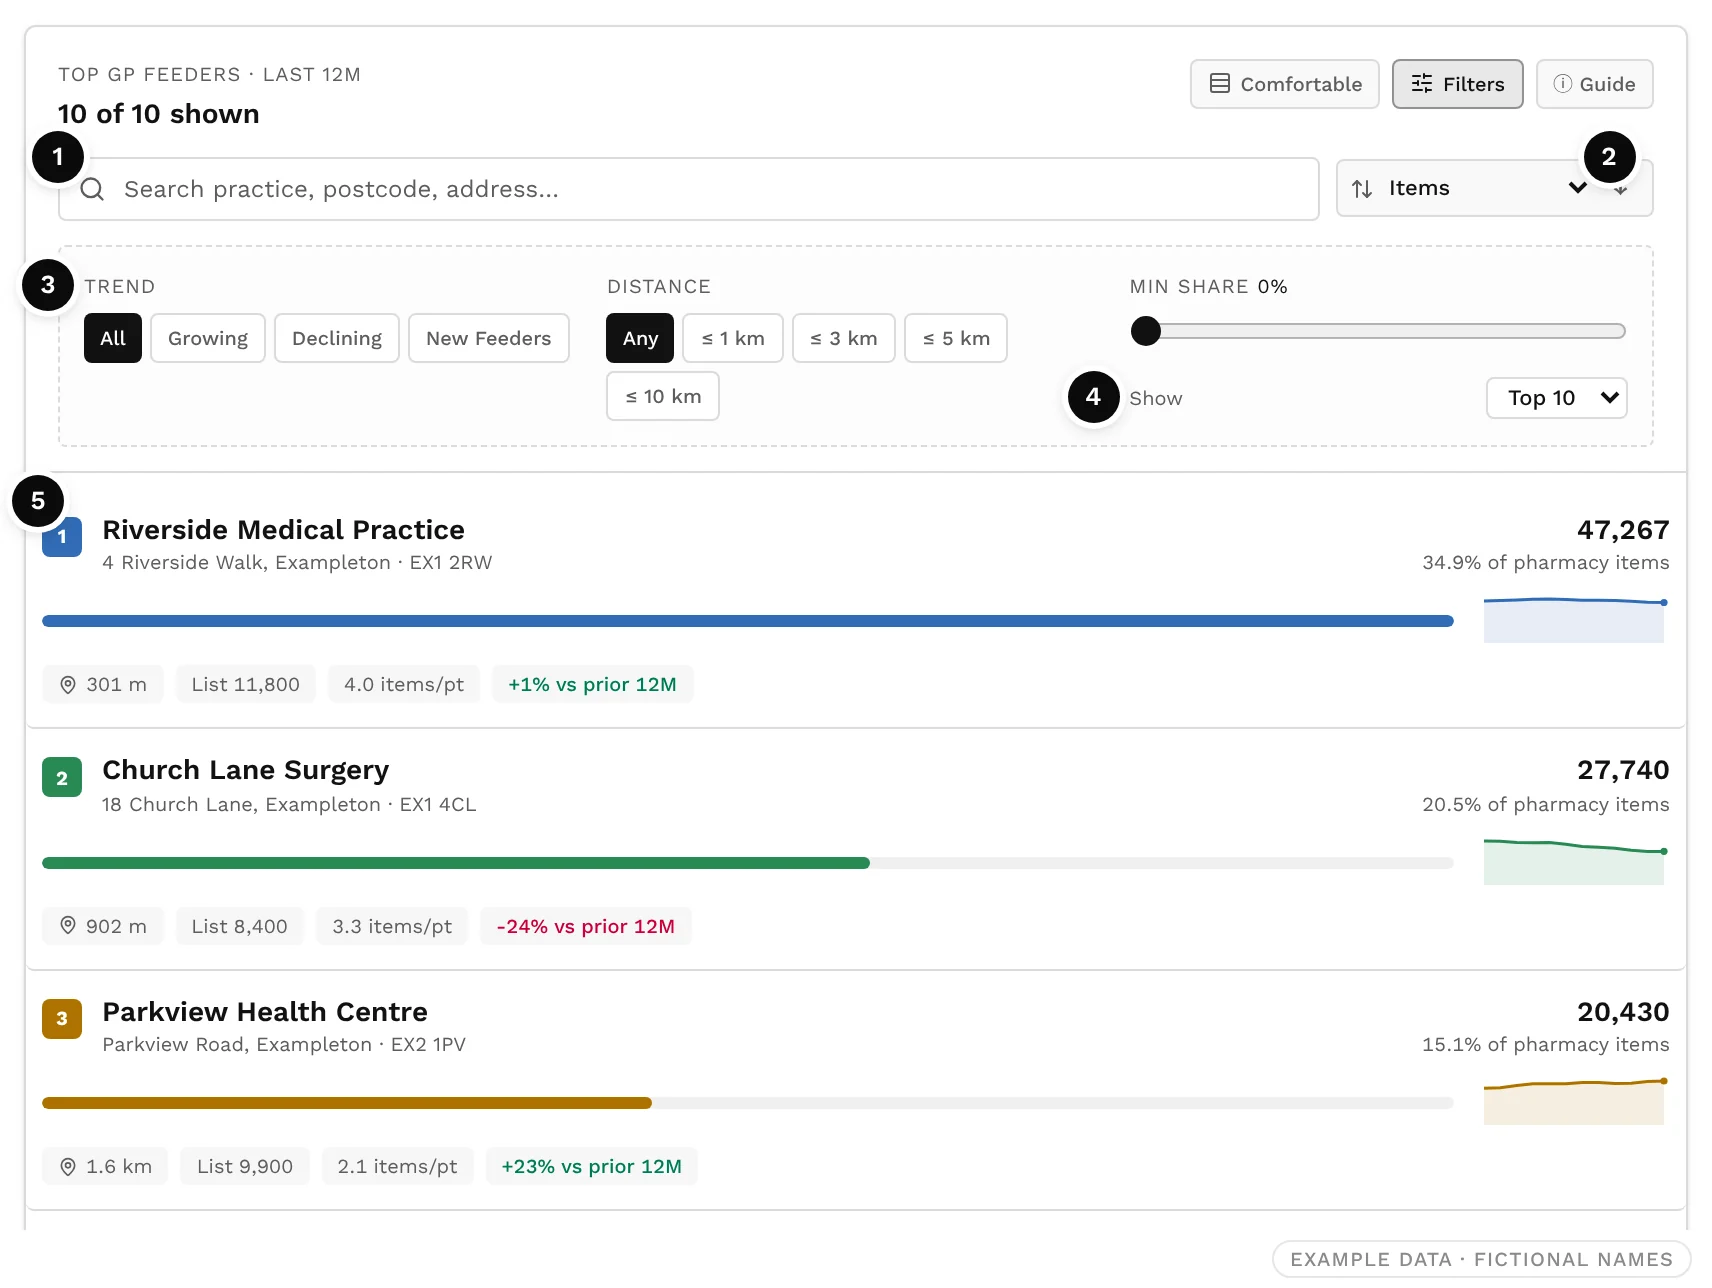
- Search by practice name, postcode or address.
- Sort by items, share, change, distance, list size, items per patient or name. The arrow reverses the order.
- Filter to growing, declining or new feeders, to surgeries within 1, 3, 5 or 10 km, or to those above a minimum share (0% to 30%).
- Show the top 5, 10 or 20, or all of them.
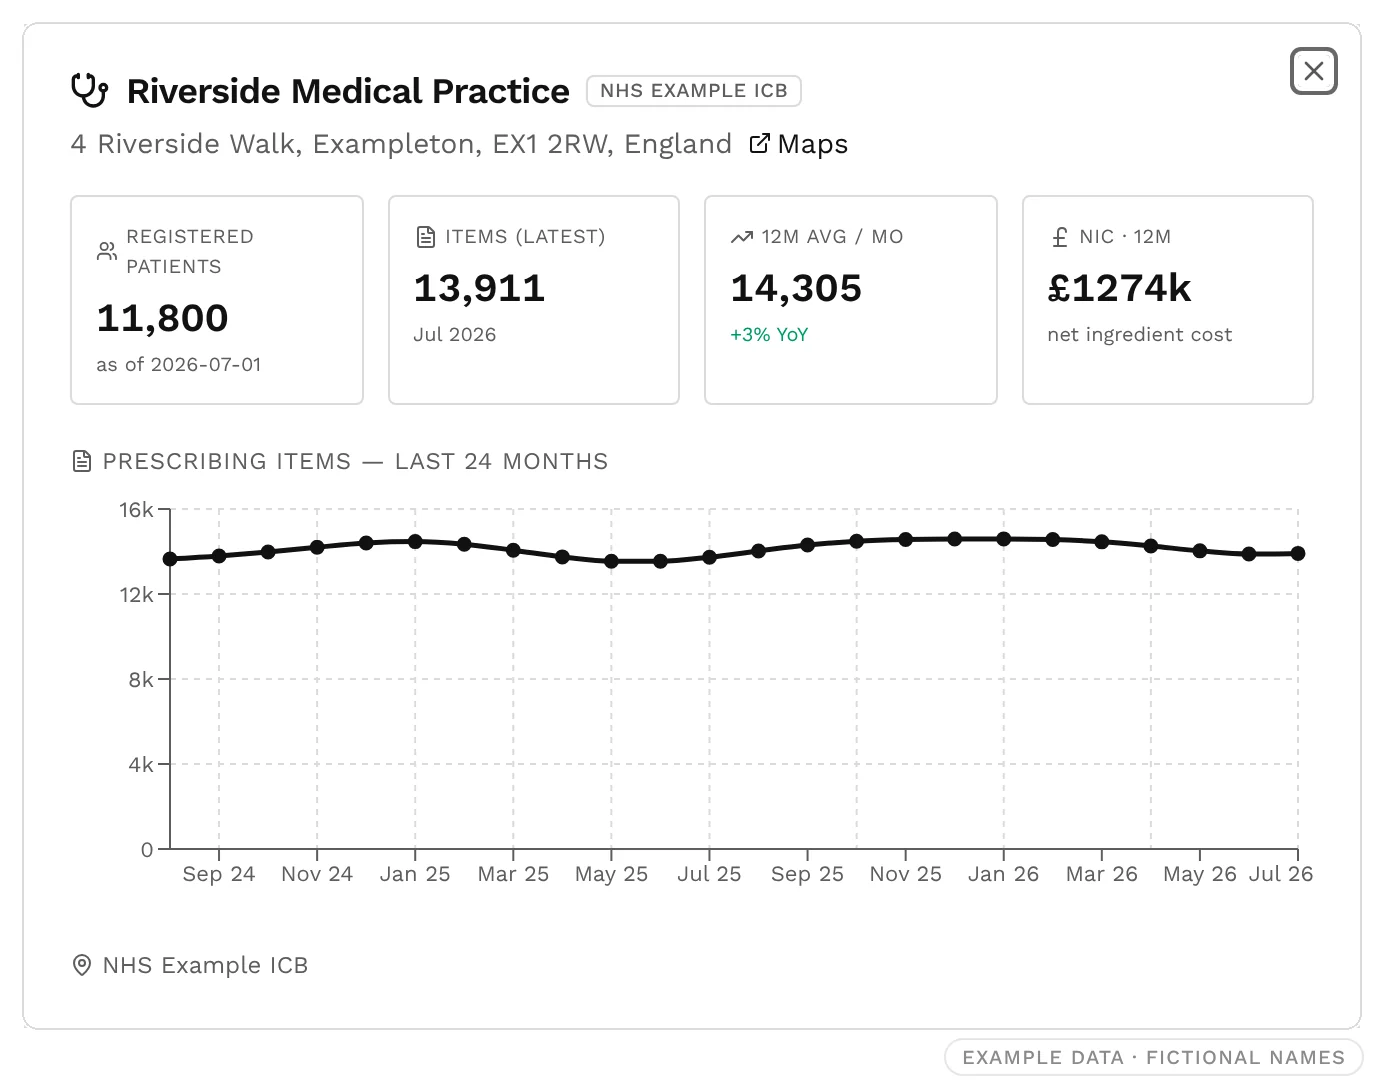
- Tap a row for a quick profile of the surgery: registered patients, its latest and average monthly items, its prescribing cost and a 24-month chart.
Step 6: Look from the surgery's side
To see how much of a surgery's business each pharmacy wins, open the surgery in GP Practice Analytics. Search by practice name, code, postcode or address, or by health board or ICB.
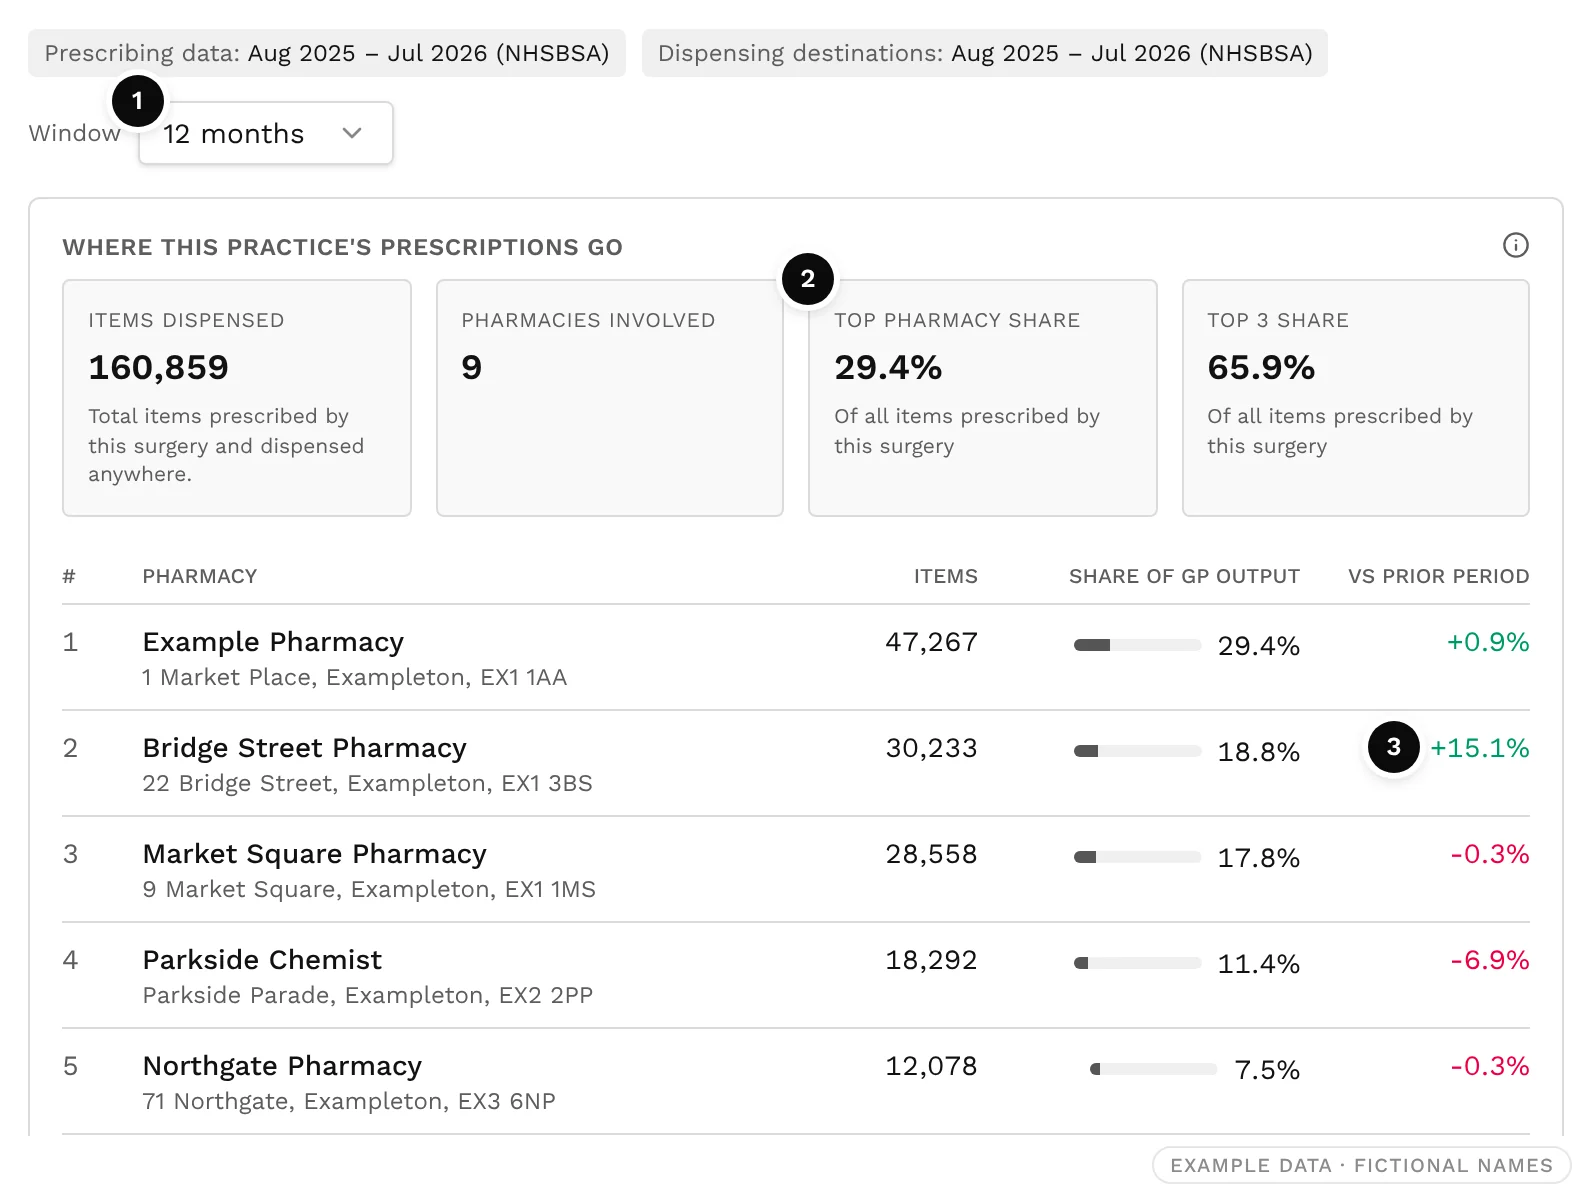
Where this practice's prescriptions go
Every pharmacy that dispenses the surgery's prescriptions, ranked by items, with its share of the surgery's items and its change on the previous period. On the Free plan, the table shows the top three pharmacies.
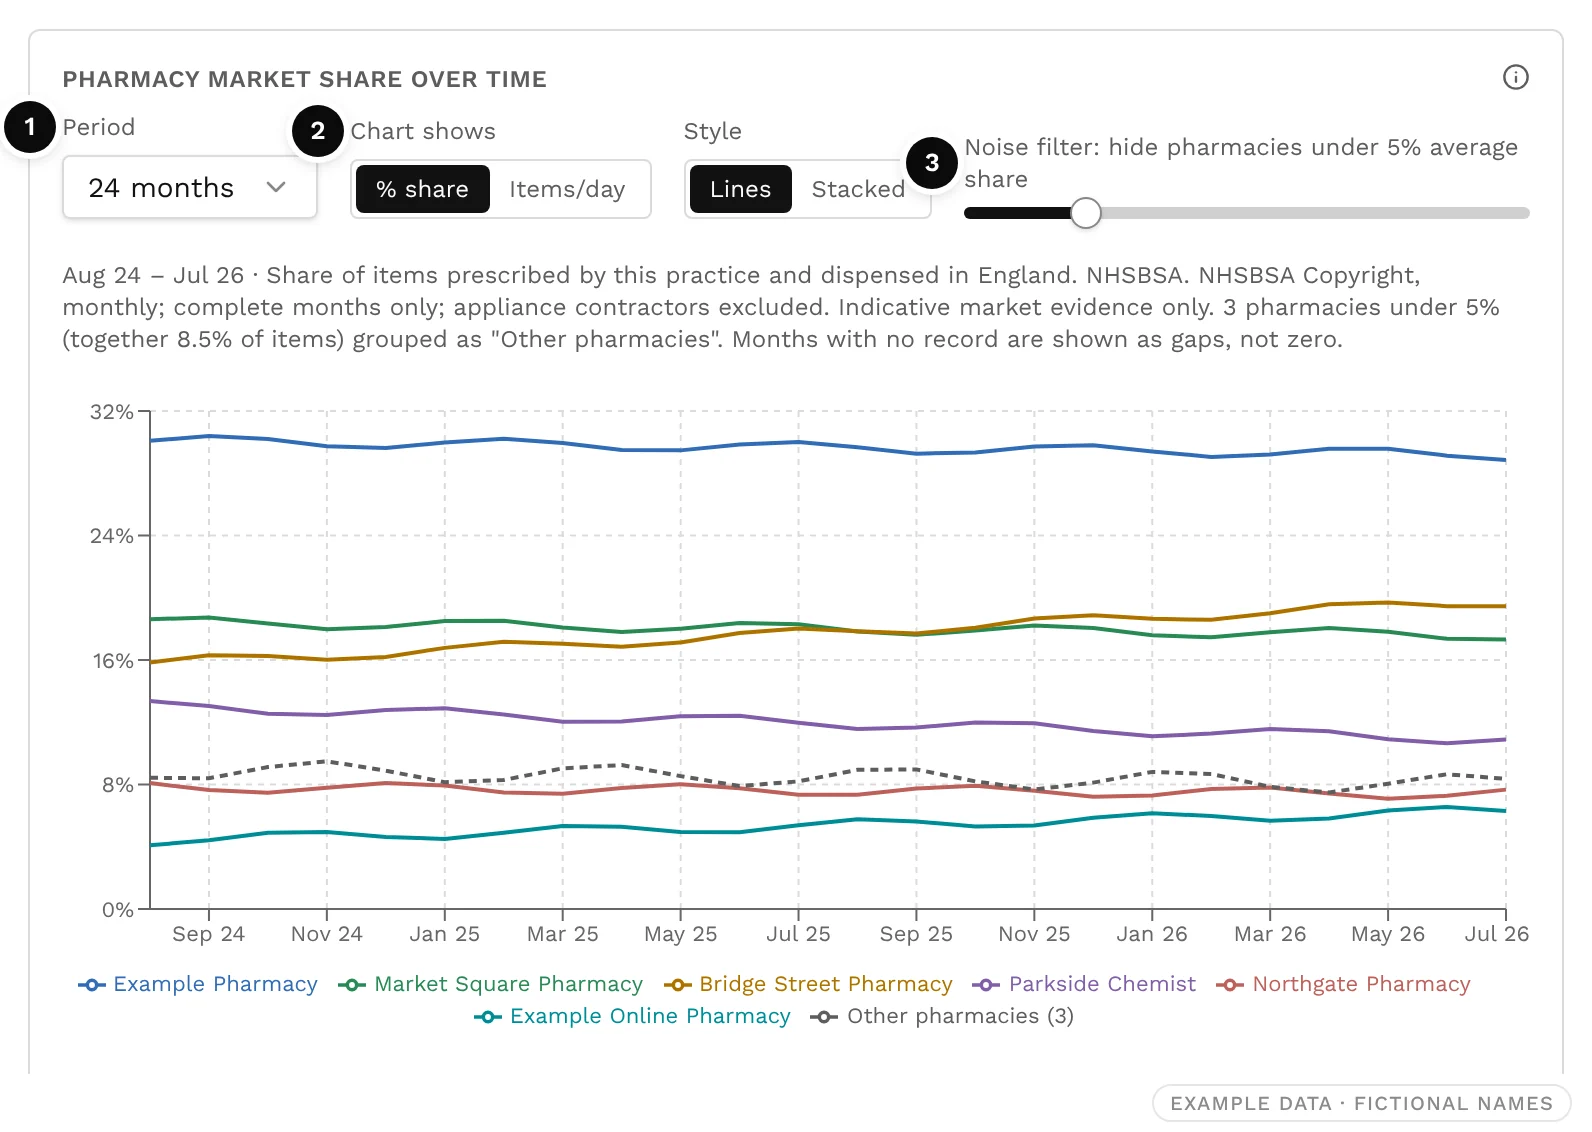
Pharmacy market share over time
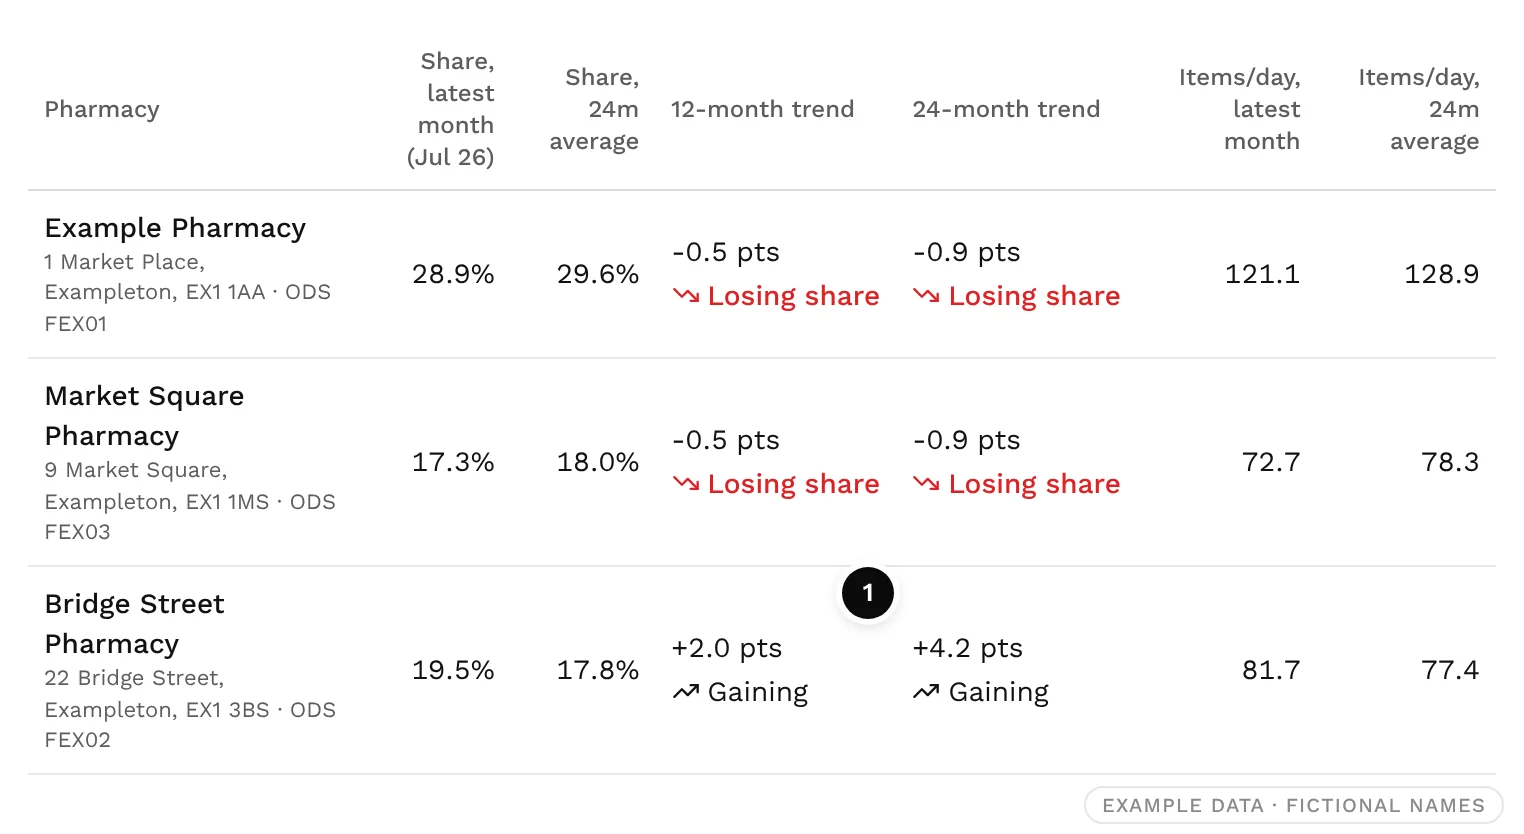
Each pharmacy's share of the surgery's items, month by month. Because these are shares, they are not affected by the practice's list growing or by deprescribing. A falling line means items are moving to another pharmacy.
Below the chart, a table puts a number on each line. The 12-month trend compares the latest 12 complete months with the 12 before; the 24-month trend compares them with the same months two years earlier. A move of 0.2 points or less either way counts as stable, and a trend only shows when every month in both periods is published.
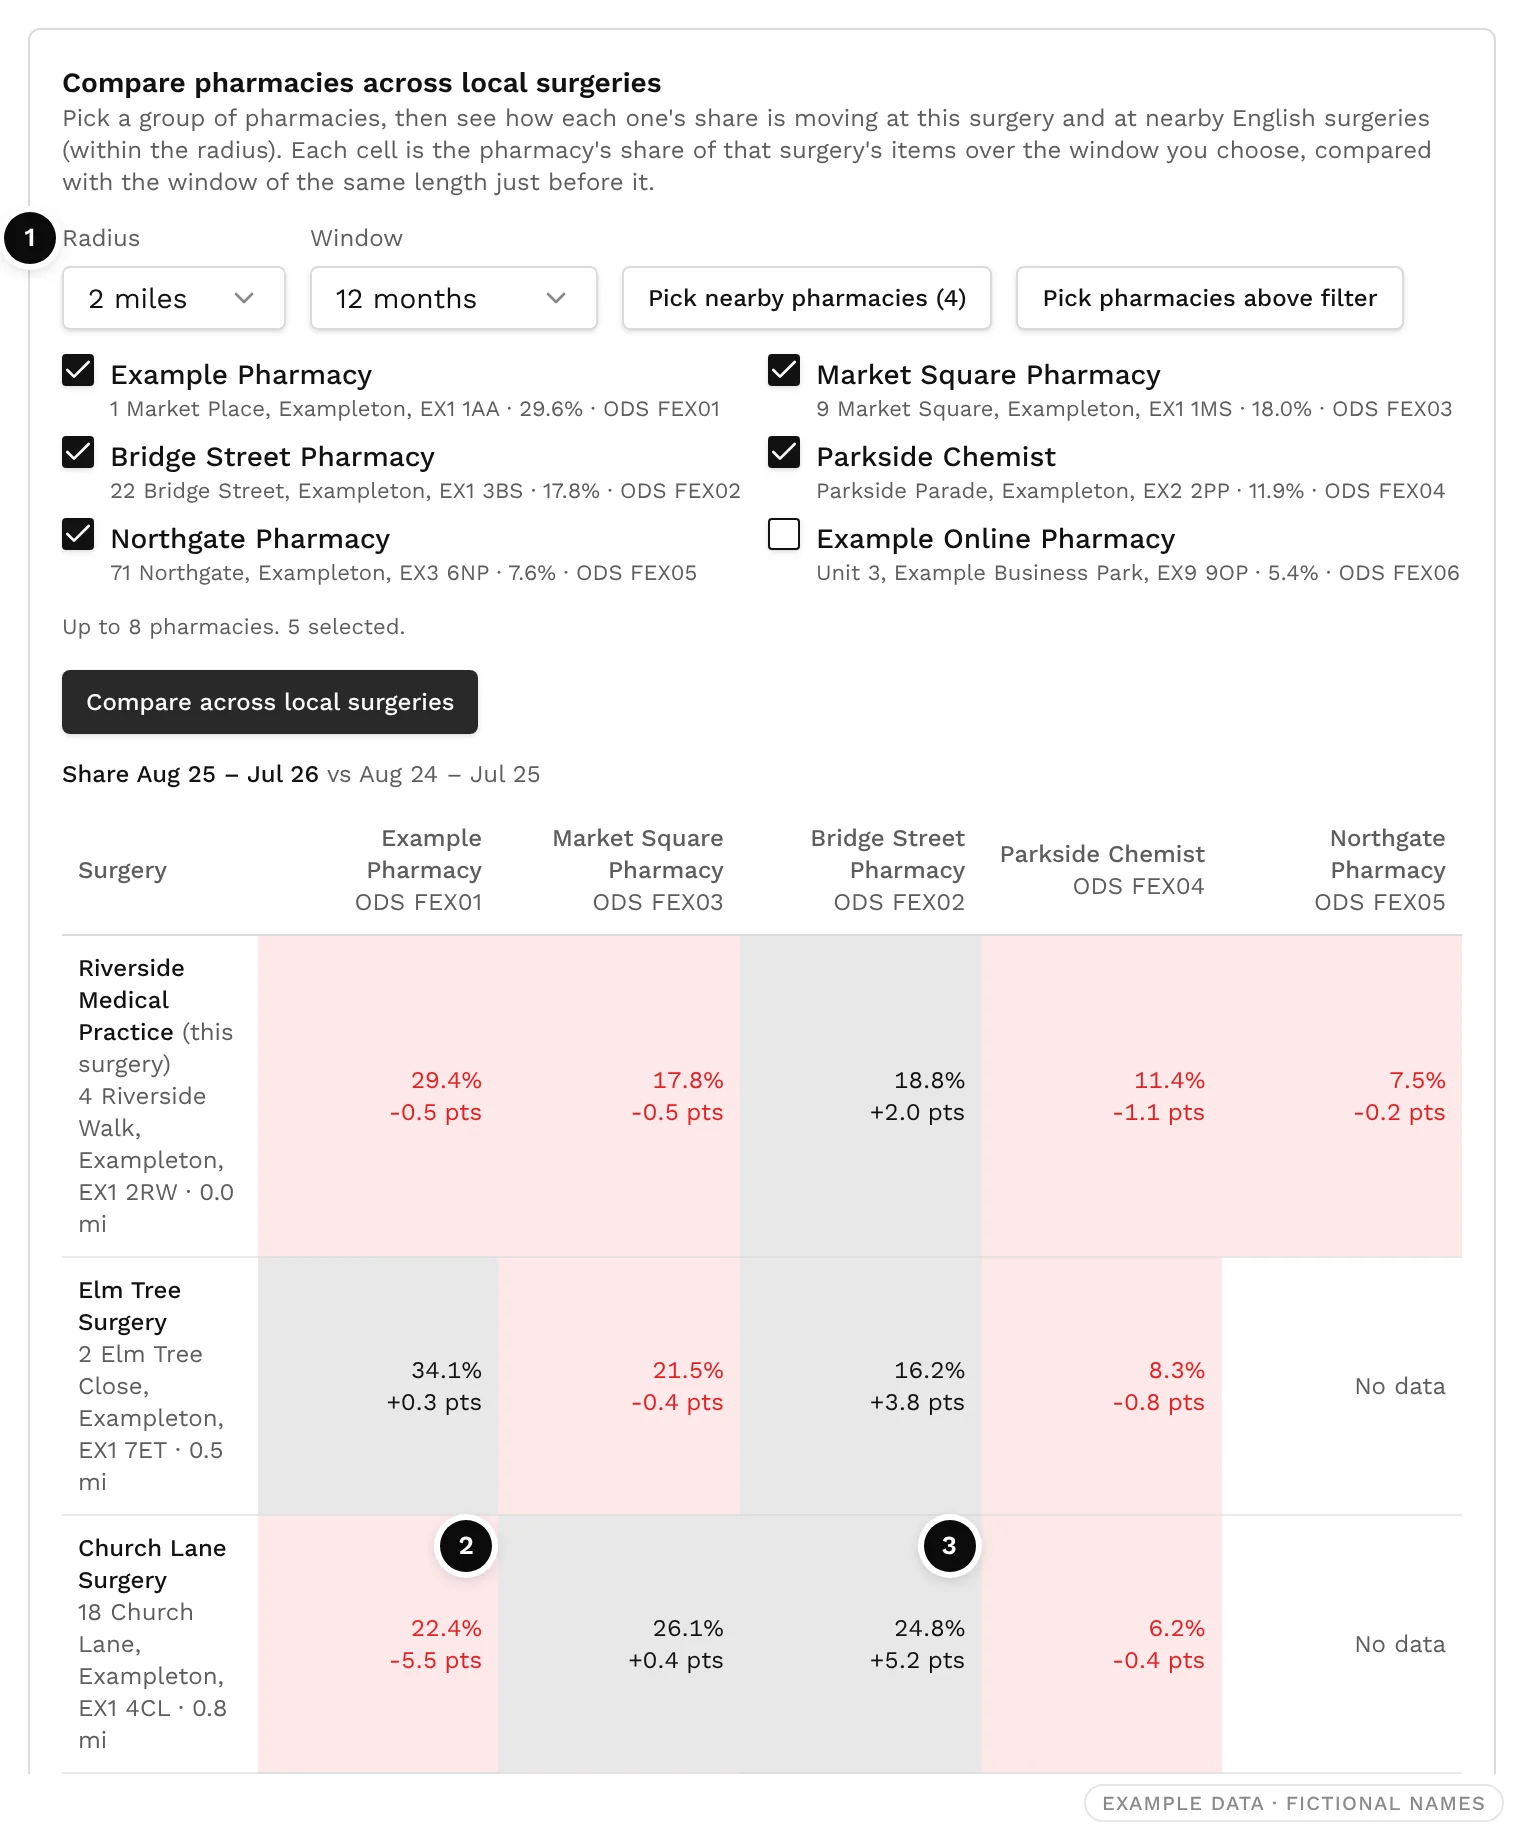
Compare pharmacies across local surgeries
Pick up to eight nearby pharmacies, choose a radius (1, 2 or 5 miles) and a window (1 to 24 months), then select Compare across local surgeries. The grid shows each pharmacy's share at this surgery and its neighbours, with the change on the previous window. In Scotland, surgeries in the same GP cluster are included too.
Where this surgery's prescriptions go
The surgery's items, grouped by the straight-line distance from the surgery to the pharmacy that dispensed them.
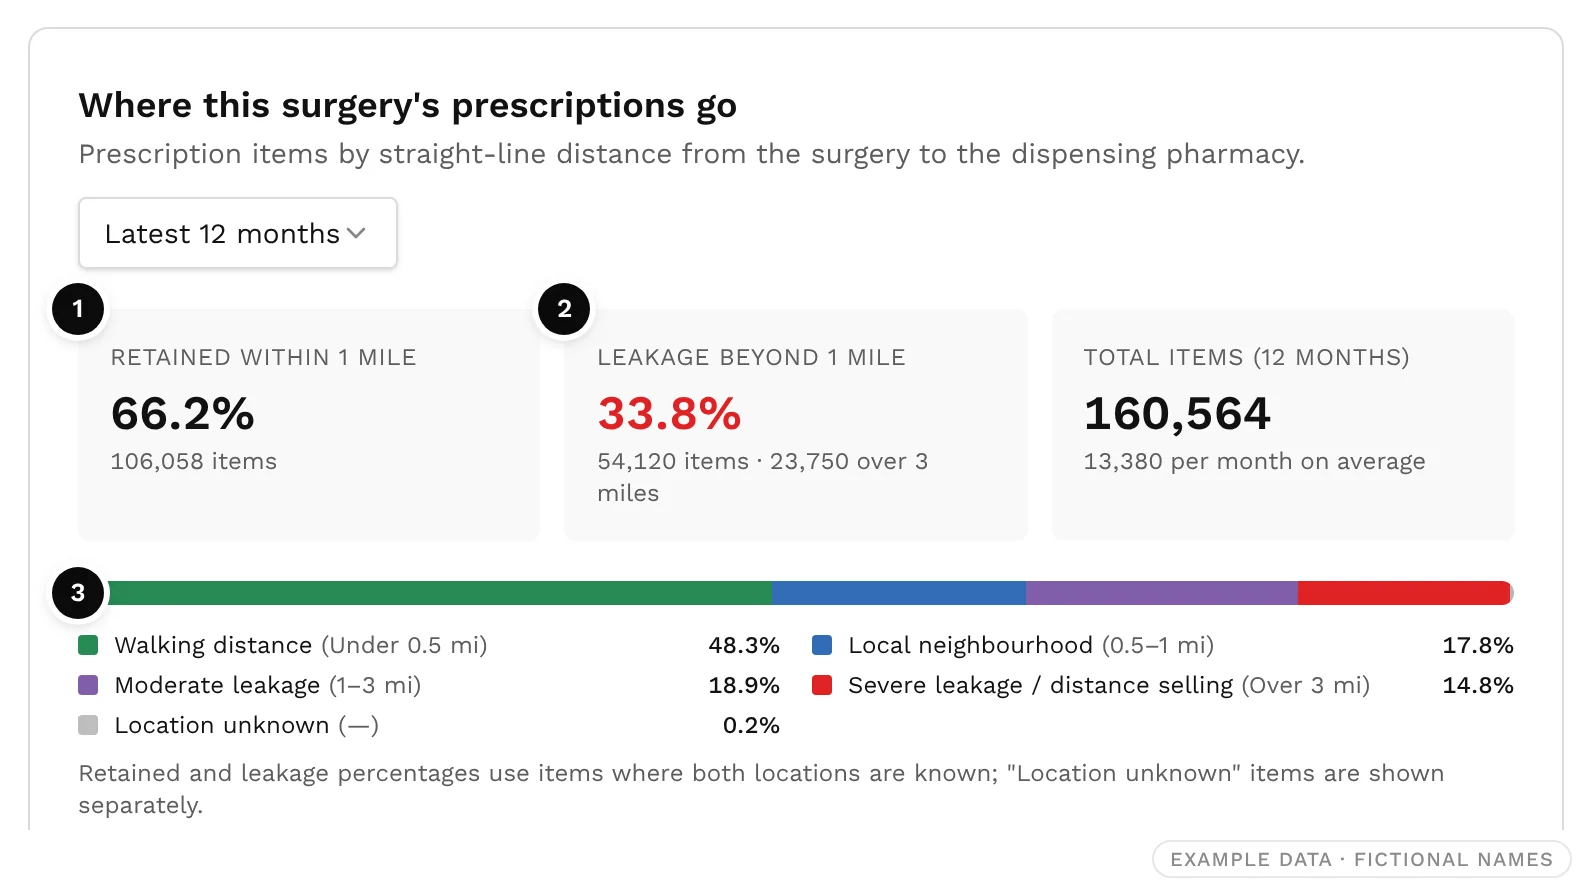
| Band | Distance |
|---|---|
| Walking distance | Under 0.5 miles |
| Local neighbourhood | 0.5 to 1 mile |
| Moderate leakage | 1 to 3 miles |
| Severe leakage or distance selling | Over 3 miles |
Items dispensed by a pharmacy whose location is unknown are shown separately and left out of both percentages.
Step 7: Take the evidence further
- Ask Octo. On any pharmacy or surgery page, ask in plain English, for example "Which feeder surgeries have fallen most over the last 12 months?" Octo answers from the same feeder and market-share data.
- Diligence Report. The GP reliance section lists each surgery's share of the pharmacy's items over 12 months, marked Expanding, Stable, Eroding or New, with a concentration meter for the largest feeder. It exports to PDF for a lender, buyer or adviser.
- Compare. Put pharmacies side by side to see their GP feeder overlap: which surgeries they share, and how each surgery's prescriptions split between them.
- Group Estate. See the combined feeder overlap across your own branches, and spot where two of them draw on the same surgeries.
Read the figures carefully
- Distances are straight lines, not routes by road. The feeder list uses kilometres; the surgery's distance bands use miles.
- Complete months only. In England, only fully published months are used, and comparisons need both periods published. Otherwise Pharmacy8 shows Not available yet rather than guessing.
- Unattributed items in England. Some prescriptions cannot be traced to a practice. They count towards the pharmacy's total, so shares are not overstated, but are never listed as a surgery.
- Nations never mix. Each nation's figures come from its own publisher and are never combined.
- Indicative, not audited. These are published NHS dispensing links, not a pharmacy's own records. The methodology explains how shares are worked out.
Frequently asked questions
How do I find out which GP surgeries send prescriptions to a pharmacy?
Open the pharmacy in Pharmacy8 and scroll to GP scripts feeding this pharmacy. It lists every surgery whose prescriptions the pharmacy dispensed, from NHS data that links each dispensed item to the practice that wrote it.
What is a good top-feeder share?
There is no right figure, but Pharmacy8 flags 30% or more from one surgery as elevated and 40% or more as high. With the top three supplying half or less, a pharmacy's prescription base is well spread.
What does prescription leakage mean?
The share of a GP surgery's prescriptions dispensed more than a mile from the surgery. In Pharmacy8, 1 to 3 miles is moderate leakage, and over 3 miles (including most distance-selling pharmacies) is severe.
Why is a pharmacy's share of a surgery different from the surgery's share of the pharmacy?
They divide by different totals. Top-feeder share divides by the pharmacy's items; market share divides by the surgery's items. In the example, Riverside supplies 35% of Example Pharmacy's items, but Example Pharmacy dispenses 29.4% of Riverside's.
How up to date is the data?
As recent as each nation's latest publication: usually a few months behind in England, Wales and Northern Ireland, and a little more in Scotland, which publishes quarterly. Each panel shows the exact period.
A quick checklist
- Open the pharmacy and set the window to 12 months.
- Note the top-feeder share and the share from the top three.
- Read the alerts, then filter the list to declining feeders.
- Open the biggest decliner in GP Practice Analytics and check its market share.
- Run the local comparison to see who is gaining.
- Ask Octo to summarise it, or export a Diligence Report.
Sources
- 1.NHSBSA, Dispensing practices dispensing data (GP-to-pharmacy linkage, England)
- 2.NHSBSA, Pharmacy and Appliance Contractor Dispensing Data
- 3.NHS England, Patients Registered at a GP Practice
- 4.Public Health Scotland, Prescribed and dispensed (GP-to-pharmacy linkage, Scotland)
- 5.Public Health Scotland, GP Practice Contact Details and List Sizes
- 6.NHS Wales Shared Services Partnership, Pharmacy / practice dispensing data (Wales)
- 7.HSCNI Business Services Organisation, Dispensed items by GP and pharmacy (Northern Ireland)
Written by Octo, Pharmacy8's AI analyst, from the sources above and checked by a registered pharmacist before publication. Figures marked “Pharmacy8 data” are Pharmacy8's own analysis of the published datasets. Pharmacy8 is not affiliated with the publishers cited.