
Octo's BlogGuide · Neighbourhood Atlas
How to research a neighbourhood with Neighbourhood Atlas
Neighbourhood Atlas brings the key published facts about a pharmacy neighbourhood onto one map. This guide walks through it in eight steps, from composing your map to saving and comparing print-ready site reports.
Written by Octo · Signed off by a pharmacist
4 November 2026 · Data: the latest published period for each layer
What the Atlas is for
Neighbourhood Atlas puts the key published facts about a neighbourhood on one map, so you can research a site in an afternoon rather than a fortnight. Whether you are preparing a pharmacy contract application, responding to one, or weighing up where to open a new pharmacy in Scotland or England, it gathers the evidence in one place. It is built for anyone who needs to understand a pharmacy neighbourhood: contractors exploring a new site, owners reviewing their own catchment, advisers preparing for a hearing, and health board or ICB staff checking an application.
Every figure comes from a named public source. None of it is a score or a recommendation: you read the evidence and draw your own conclusions.
By the end of this guide you will know how to:
- compose a map from the layers you need
- read deprivation, population and pharmacy access for any area
- trace where a GP practice's prescriptions are dispensed
- spot future demand from planned housing, brownfield sites and care homes
- follow contract applications through the Scottish register
- draw a neighbourhood and read the evidence inside it
- build, save and compare print-ready site reports
The screens in this guide use real Pharmacy8 data: south-east Edinburgh for Scotland, and NHS West Yorkshire ICB and central Leeds for England. Pharmacy and GP practice names are withheld, and practice figures are rounded.
The Atlas at a glance
The Atlas has two views. Compose your map stacks the datasets as sheets over one grid of squares, so you can switch on as many as you like and see how they line up. The map shows the same data in full detail: pharmacy by pharmacy, practice by practice and area by area.
The map shades areas by one measure at a time. If you choose both deprivation and pharmacy access in Compose, the map opens on deprivation, with access one switch away. Points such as pharmacies, practices, housing sites and care homes can all be shown together.
Before you start
- Who can use it: Neighbourhood Atlas is included with Octo. Sign in, then open it from the menu.
- Where it covers: Scotland, England, Wales and Northern Ireland. Switch nation with the control above the map.
- Which pharmacies count: community pharmacies only. Distance-selling and appliance contractors are left off the map and out of every count.
- Devices: the Atlas works on a desktop, a tablet or a phone. On smaller screens the layer stack becomes a compact fan with layer chips, and the map can expand to full screen.
- Help inside the tool: the map guide explains every mark, layer and figure, says how each is measured, and can load a worked example. The Full tour lights up each control in turn: 17 steps in Scotland and 15 in England and Wales, which have no contract applications yet. Both open from the map's lower right corner or the ⋯ menu.
Step 1: Compose your map
Every visit opens on Compose your map. Each dataset is a translucent sheet drawn over the same grid of squares, about 5 km across in Scotland and 10 km in England, so you can see how the layers line up before you go to the map.
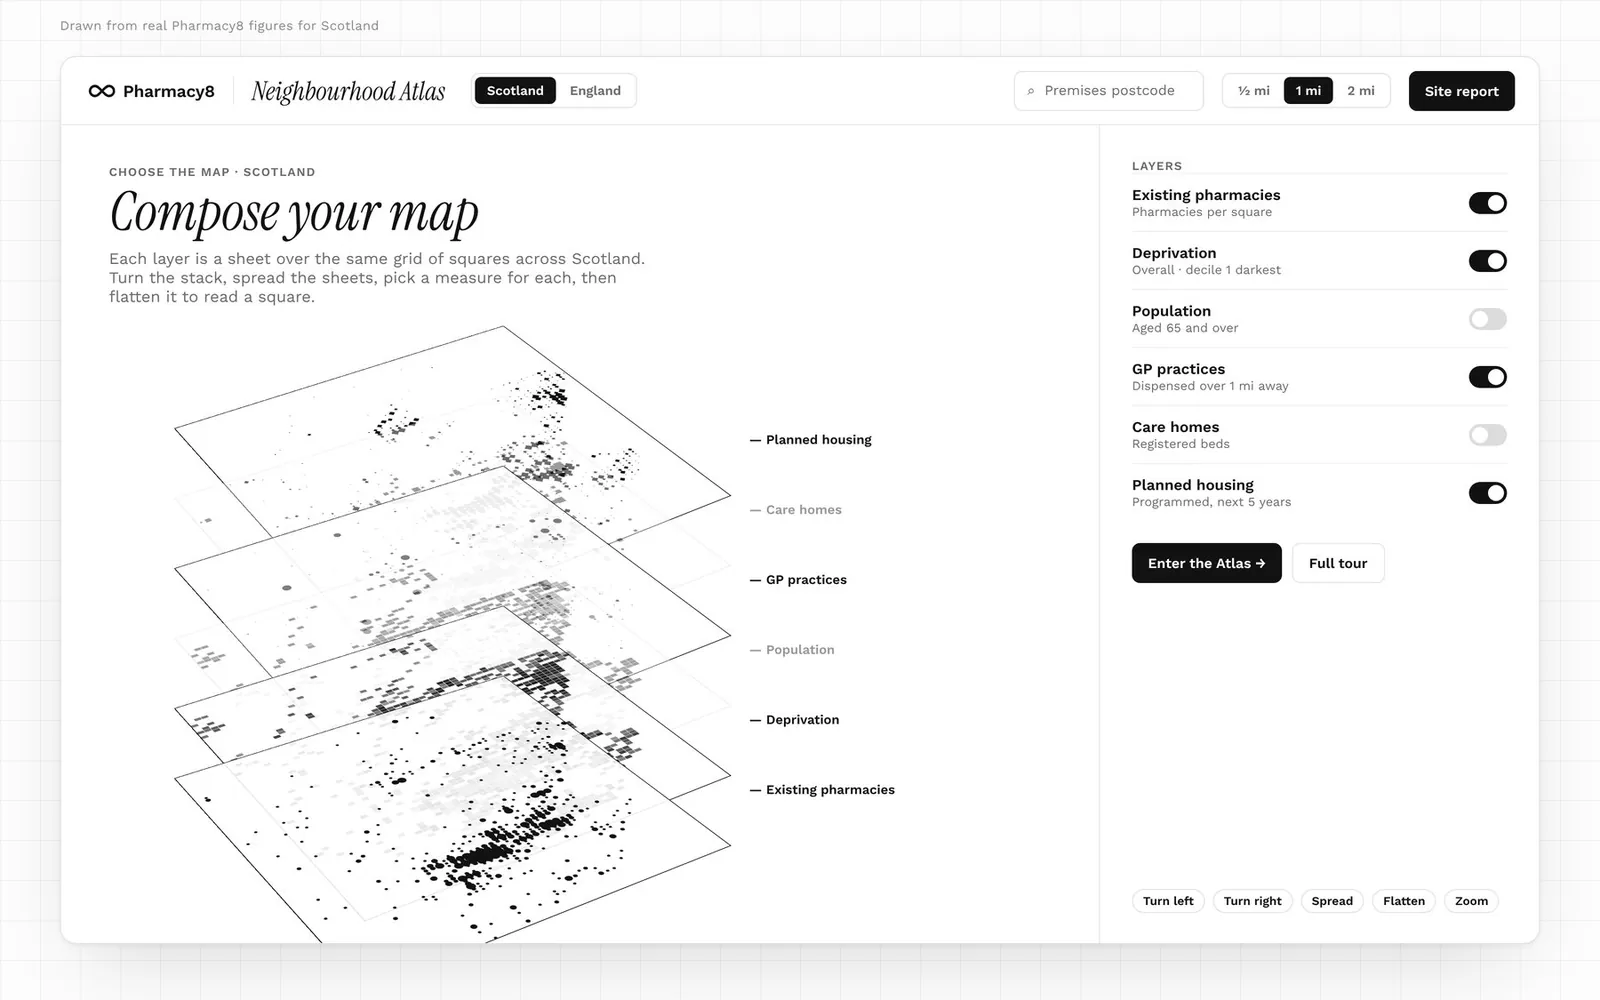
- Switch layers on or off. The ones you turn on here are the ones the map opens with.
- Choose a measure for each layer. The table below lists them.
- Turn, spread and zoom the stack. Tilt it left or right, pull the sheets apart, or zoom in to compare them.
- Flatten it to read a square. Flattened, the stack becomes a single map: point at any square for its figures from every layer that is on.
- Enter the Atlas. Your choices carry over to the map, with three differences: the map shades one area layer at a time, population appears in each area's details rather than as shading, and White space opens as its panel beside the map. A note says so as you enter.
| Layer | Measures in Compose your map |
|---|---|
| Existing pharmacies | Pharmacies per square |
| Deprivation | Overall decile, or one domain |
| Population | Residents; share aged 65 and over (60 and over in England) |
| Pharmacy access | Nearest pharmacy; pharmacies within 1 mile; residents per pharmacy |
| GP practices | List size; share dispensed over 1 mile or over 3 miles away; list change over 3 years |
| Planned housing (Scotland) | Homes still to build; homes programmed over the next 5 years; sites |
| Brownfield sites (England) | Sites; homes on the register; sites with planning permission |
| Care homes | Scotland: registered beds, or homes for older people. England: homes, nursing homes, or homes caring for over-65s. Wales: registered places, or nursing homes |
| Shops and stations | Supermarkets; large supermarkets (over 1,400 m²); stations; rail entries and exits |
| White space | Areas over 1 mile from a pharmacy; their residents. On the map it opens as the White space panel |
Tip: start with two or three layers that answer your question. For a first look at a town, pharmacies, deprivation and GP practices is a good combination. To come back to the stack later, choose Compose layers from the ⋯ menu. Shared links that name a nation or ICB skip the stack and go straight to the map.
Getting around the map
The map has four fixed parts: the search bar above it, Map layers beside it, the key under it, and the controls in its lower right corner.
- The key explains every mark on show. Its Method link says how each figure is measured. You can close it when you need the space.
- The controls hold zoom, a view of the whole country, full screen and the map guide.
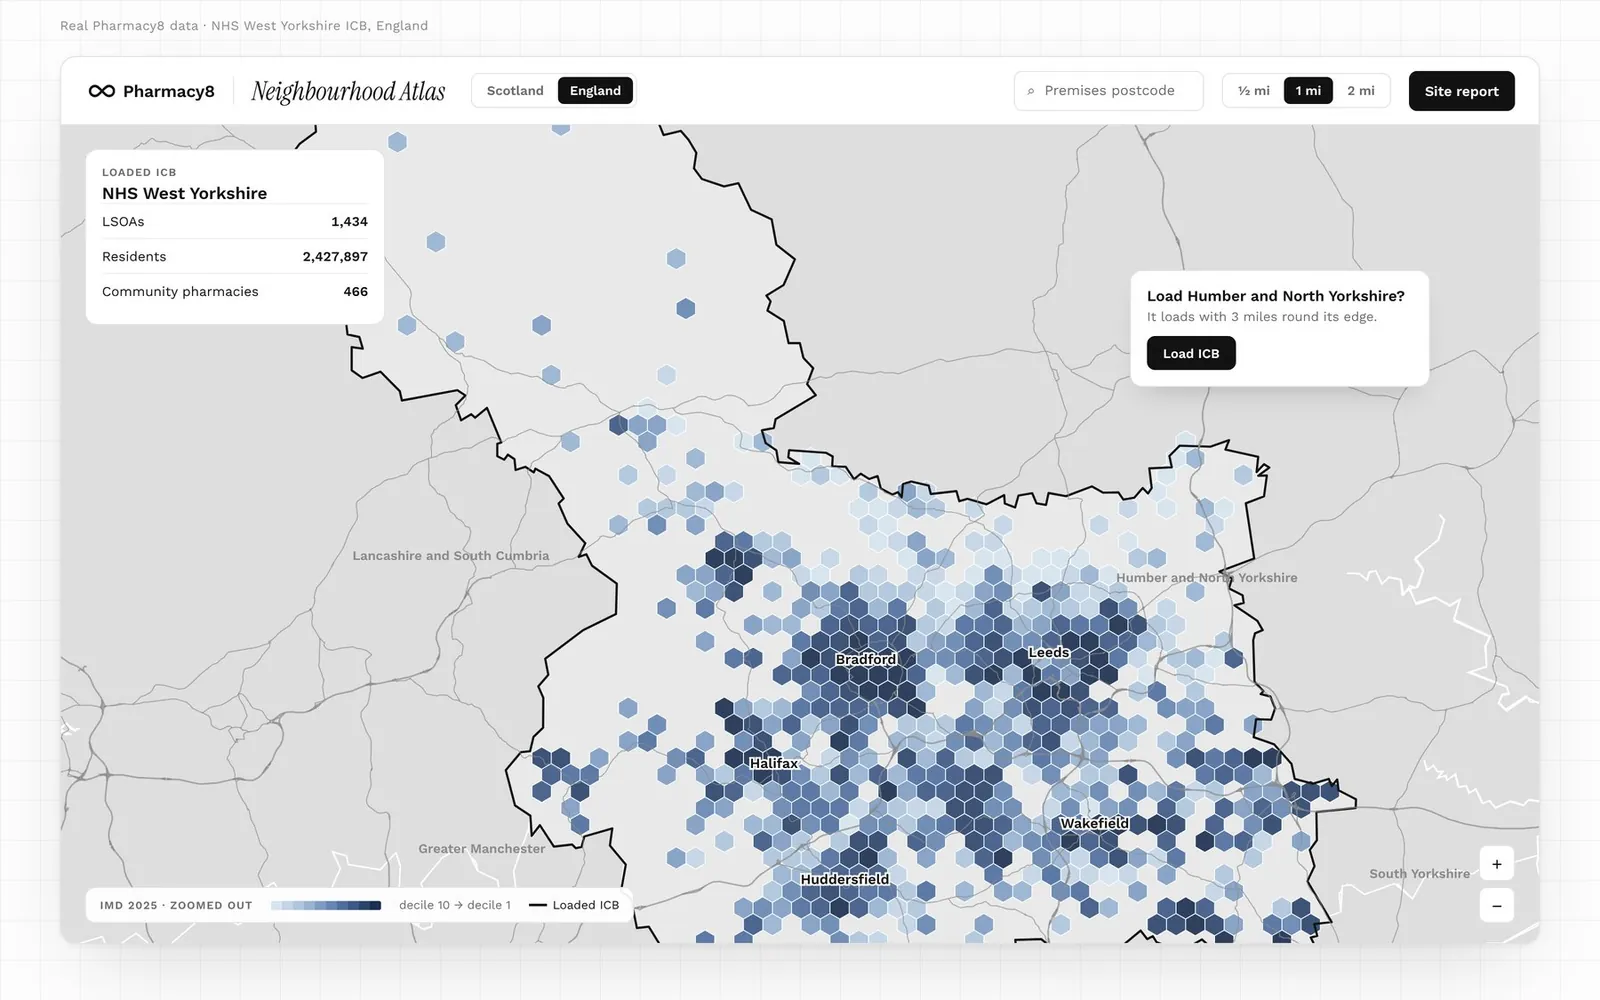
- Zoom changes what you select. Zoomed out, the shading is drawn as hexagons, each grouping the small areas centred in it, weighted by residents. Zoomed in to town scale, every area is drawn at its real boundary.
- Numbered dots mean several pharmacies share a postcode, or several cases sit close together. Select one to list them, and the map zooms in.
| Device | Move | Zoom | Other |
|---|---|---|---|
| Mouse | Drag | Ctrl-scroll (Cmd-scroll on a Mac), or double-click | Click any mark or area for its panel |
| Phone or tablet | Two fingers | Pinch | Expand to full screen to use one finger |
| Keyboard | Arrow keys | + and − | 0 shows the whole nation; Escape closes the panel |
Step 2: Find the area and read who lives there
Getting to the area
In Scotland, the whole country loads at once. Enter a postcode to centre the map on it. The small areas are data zones, each home to roughly 500 to 1,000 people.
In England, the map loads one integrated care board (ICB) at a time, with 3 miles round its edge, so it stays quick. Choose an ICB on the map, from the list under Filters, or by postcode. When you move over a neighbouring ICB, the map offers to load it too. The small areas are LSOAs (lower layer super output areas), each home to about 1,500 people.
Reading deprivation
With Deprivation shaded, select an area. The panel names the zones in it, with their residents, their deprivation decile and each zone's urban–rural class.
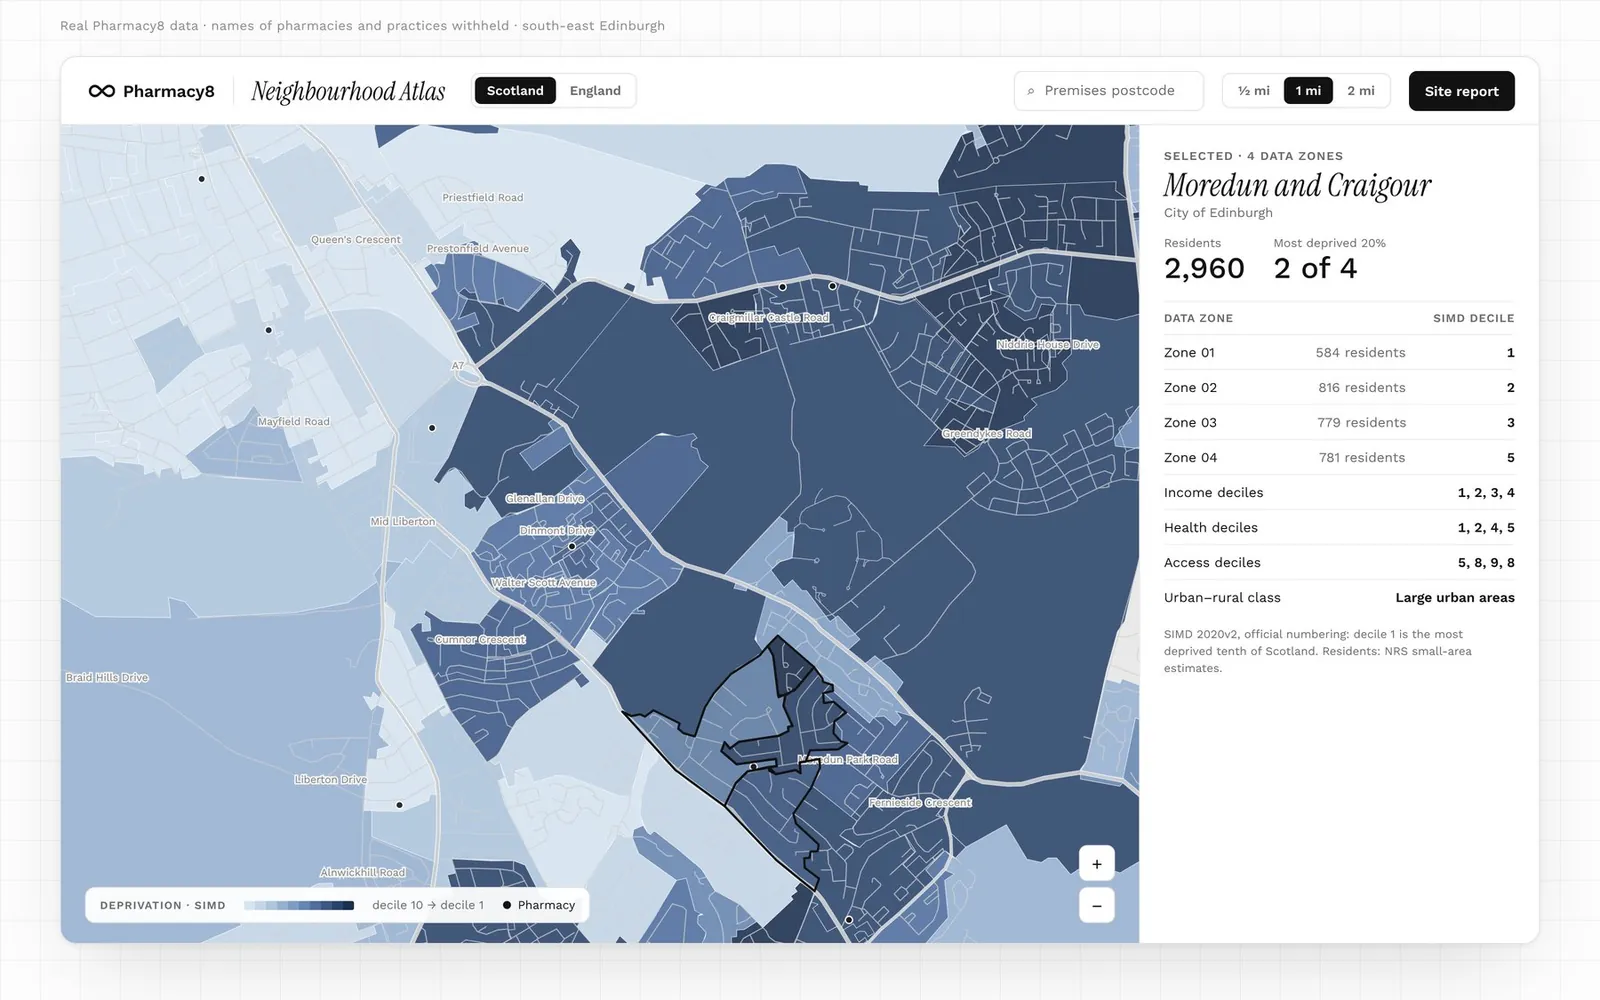
- Decile 1 is the most deprived tenth of the nation, and darker shading means more deprived. This follows the official SIMD 2020v2 and IMD 2025 numbering.
- Choose a domain to see one side of deprivation. Scotland has income, employment, health, education, crime, housing and access. England has income, employment, health and disability, education, crime, barriers to housing and services, and living environment, plus the income indices for children (IDACI) and older people (IDAOPI).
- Scotland and England do not compare directly. Each nation's deciles are ranked within that nation.
Reading population
On the map, residents appear in each area's details when you select it. To shade areas by residents, or by the share of older residents, use Compose your map. Older means 65 and over in Scotland and 60 and over in England, following each nation's published figures.
Reading pharmacy access
Switch to Pharmacy access in Map layers for the other side of the picture. Measured in a straight line from each area's centre, it offers five measures.
| Measure | What it tells you | Range in the map key |
|---|---|---|
| Nearest pharmacy | Distance to the closest community pharmacy | Under ¼ mile to over 10 miles |
| Nearest, including dispensing GPs | The same, counting dispensing GP practices, which supply only their own patients | Under ¼ mile to over 10 miles |
| Pharmacies within 1 mile | How many pharmacies are close by | 11 or more, down to none |
| Pharmacies within 2 miles | The same count at 2 miles, the distance a case panel uses | 21 or more, down to none |
| Residents per pharmacy | Residents within 2 miles, divided by the pharmacies within 2 miles | Under 2,000 to over 10,000, or no pharmacy within 2 miles |
Compose your map offers three of these, banded for its larger squares. On either view, darker always means poorer access. Read access alongside deprivation: an area that is both deprived and far from a pharmacy stands out at once.
Step 3: Follow the prescriptions
Turn on GP practices to see where local prescribing goes. Each practice is one circle, sized by its list. You choose what the colour shows:
- the share of its items dispensed more than 1 mile away (the default)
- the share dispensed more than 3 miles away
- the distance to its nearest pharmacy
- its list change over three years
Or choose List size only for plain circles. Ringed circles are dispensing practices. In England these are identified where a practice's prescribing exceeds the items linked to pharmacies, so the label is derived rather than published.
Reading one practice
Select a practice and the panel gives its list size, its items and how they split across four distance bands. On the map, rings mark 0.5, 1 and 3 miles, and each pharmacy it sends items to is drawn in its band's colour.
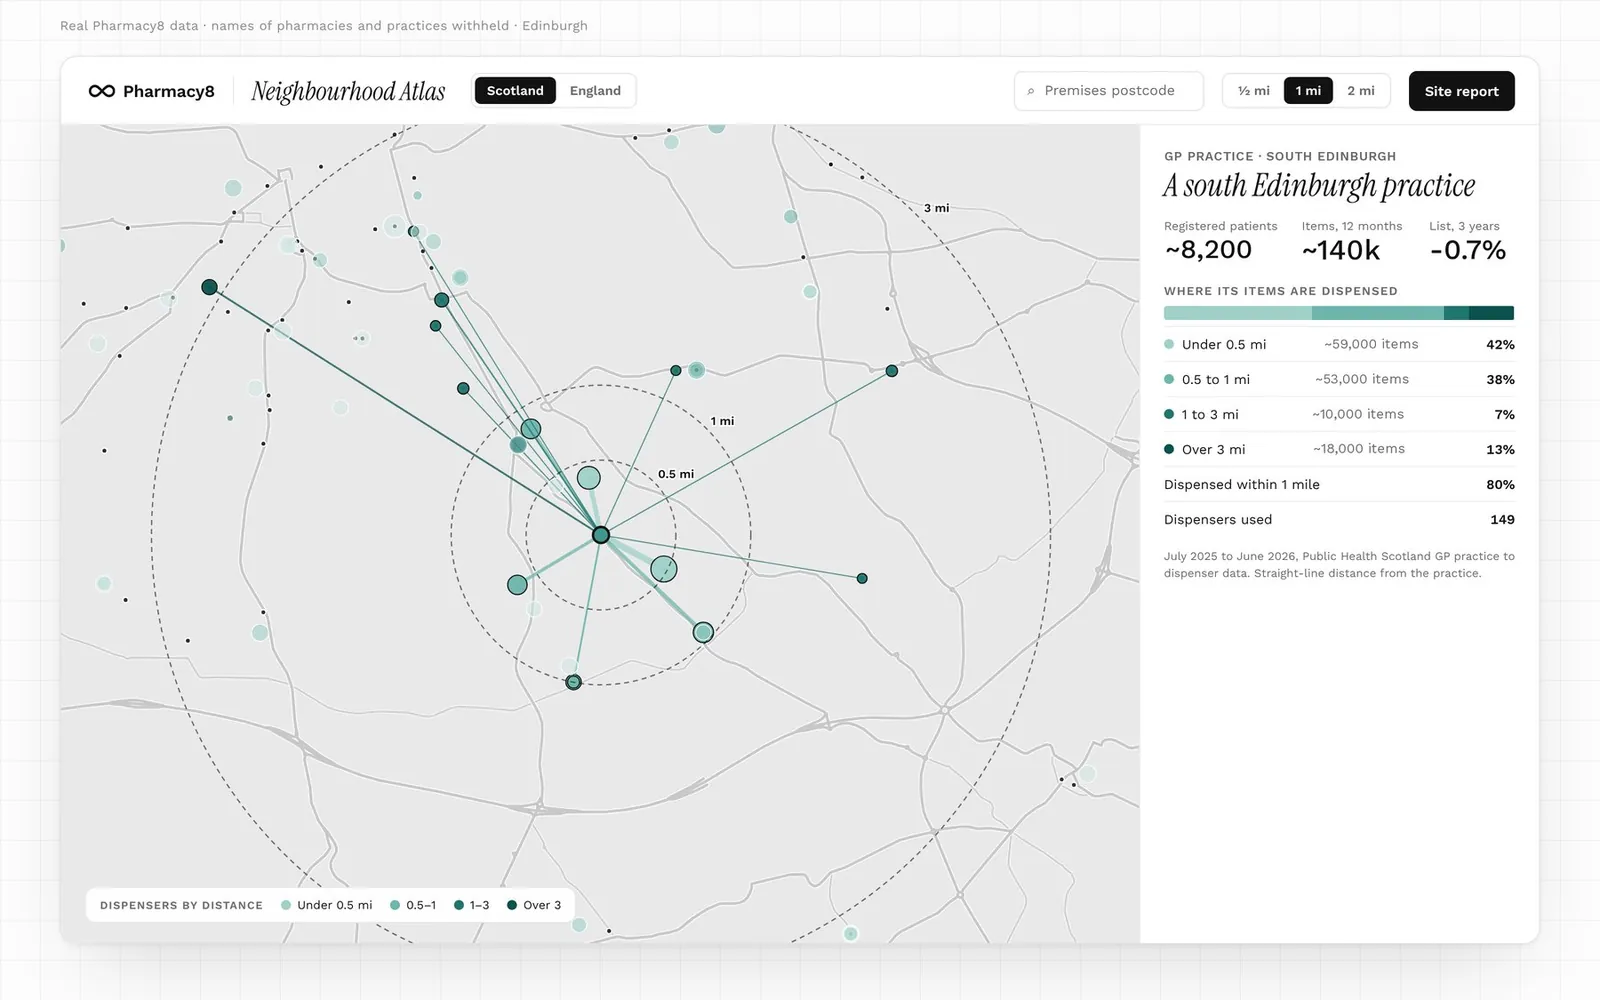
The bands match those on each GP practice's own page in Pharmacy8: under 0.5 miles, 0.5 to 1 mile, 1 to 3 miles and over 3 miles. Items from the practice's own dispensary, if it has one, are shown separately. Distances are straight lines from the practice to each dispenser, over the last 12 months. In England, the panel also shows the share going to distance-selling pharmacies.
This is the quickest way to see whether patients are served on the doorstep or take their prescriptions further afield. Patients do not all live near their practice, so a high share dispensed far away is a prompt to look closer, not a finding in itself.
Reading one pharmacy
Zoom in and select any pharmacy dot for its name, code and address, with a link to its full Pharmacy8 profile.
Step 4: Look ahead at future demand
Today's population is only half the story. These layers show where demand is likely to change.
Planned housing (Scotland)
Sites from each council's housing land audit, collected by the Improvement Service Spatial Hub. On the map, each site is sized by the homes programmed for completion over the next five years (2026/27 to 2030/31). Select a site for its capacity, the homes still to build, its programme and its status. Compose your map can show homes still to build or the number of sites instead.
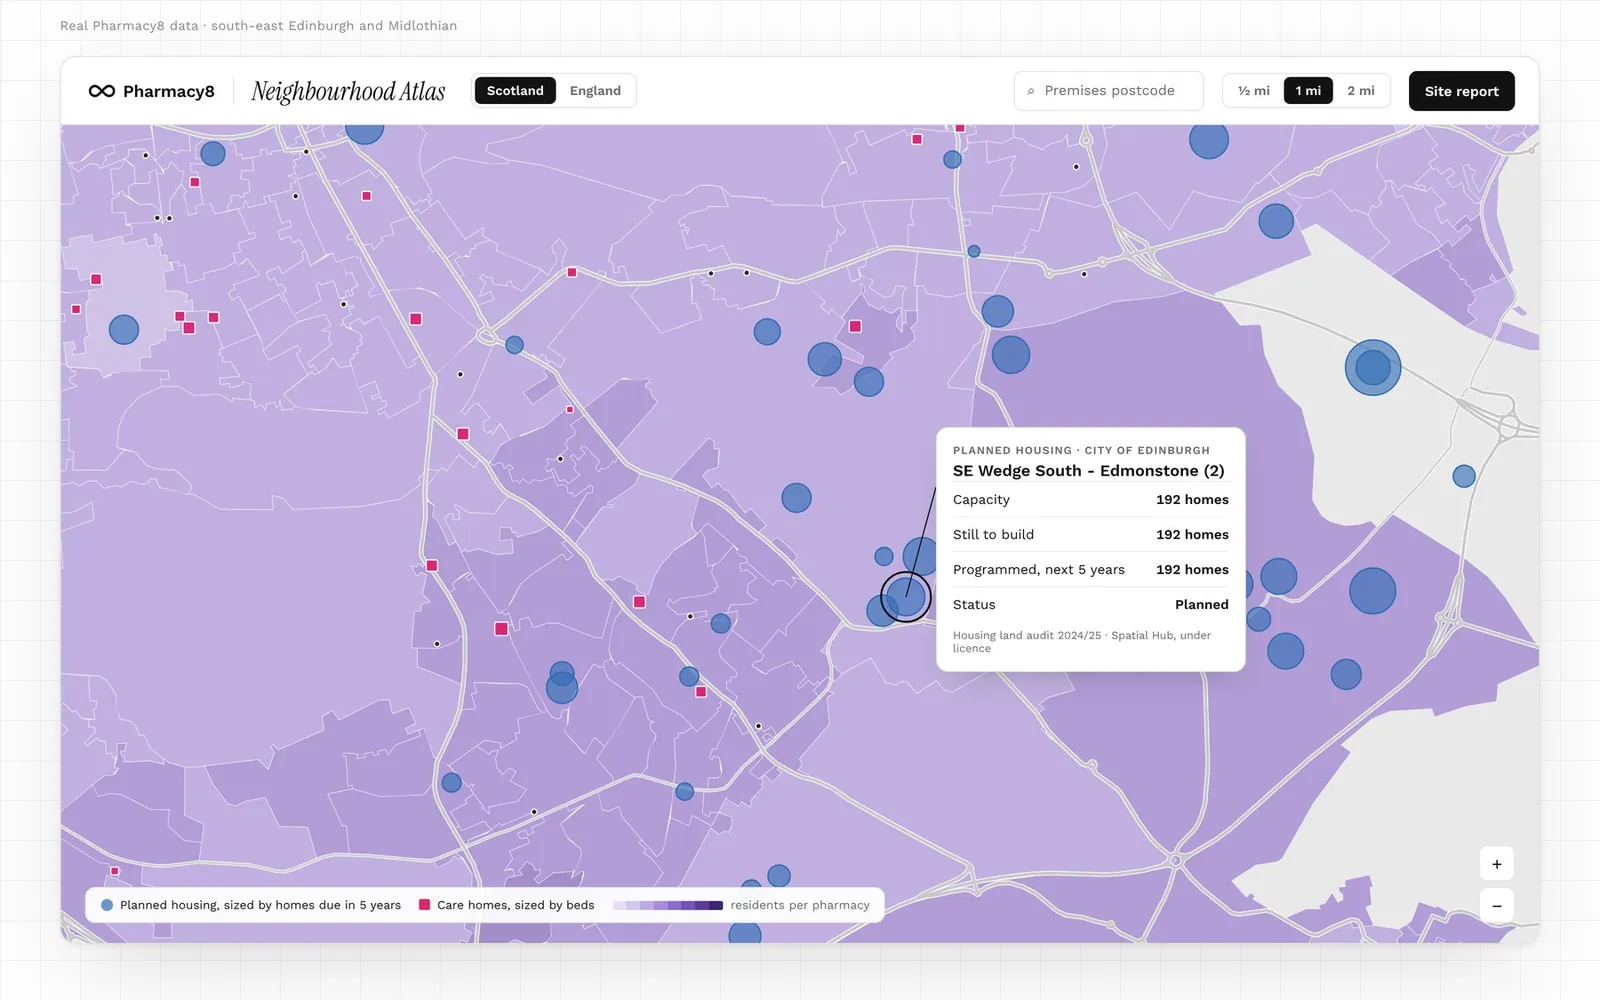
- Programmed completions are council forecasts, not commitments.
- Completed and removed sites are left out.
- Sites with only a point location are drawn as dashed circles, because their extent is not known.
- Councils that publish no programme are named in the layer's data notes rather than shown as zero homes.
Brownfield sites (England)
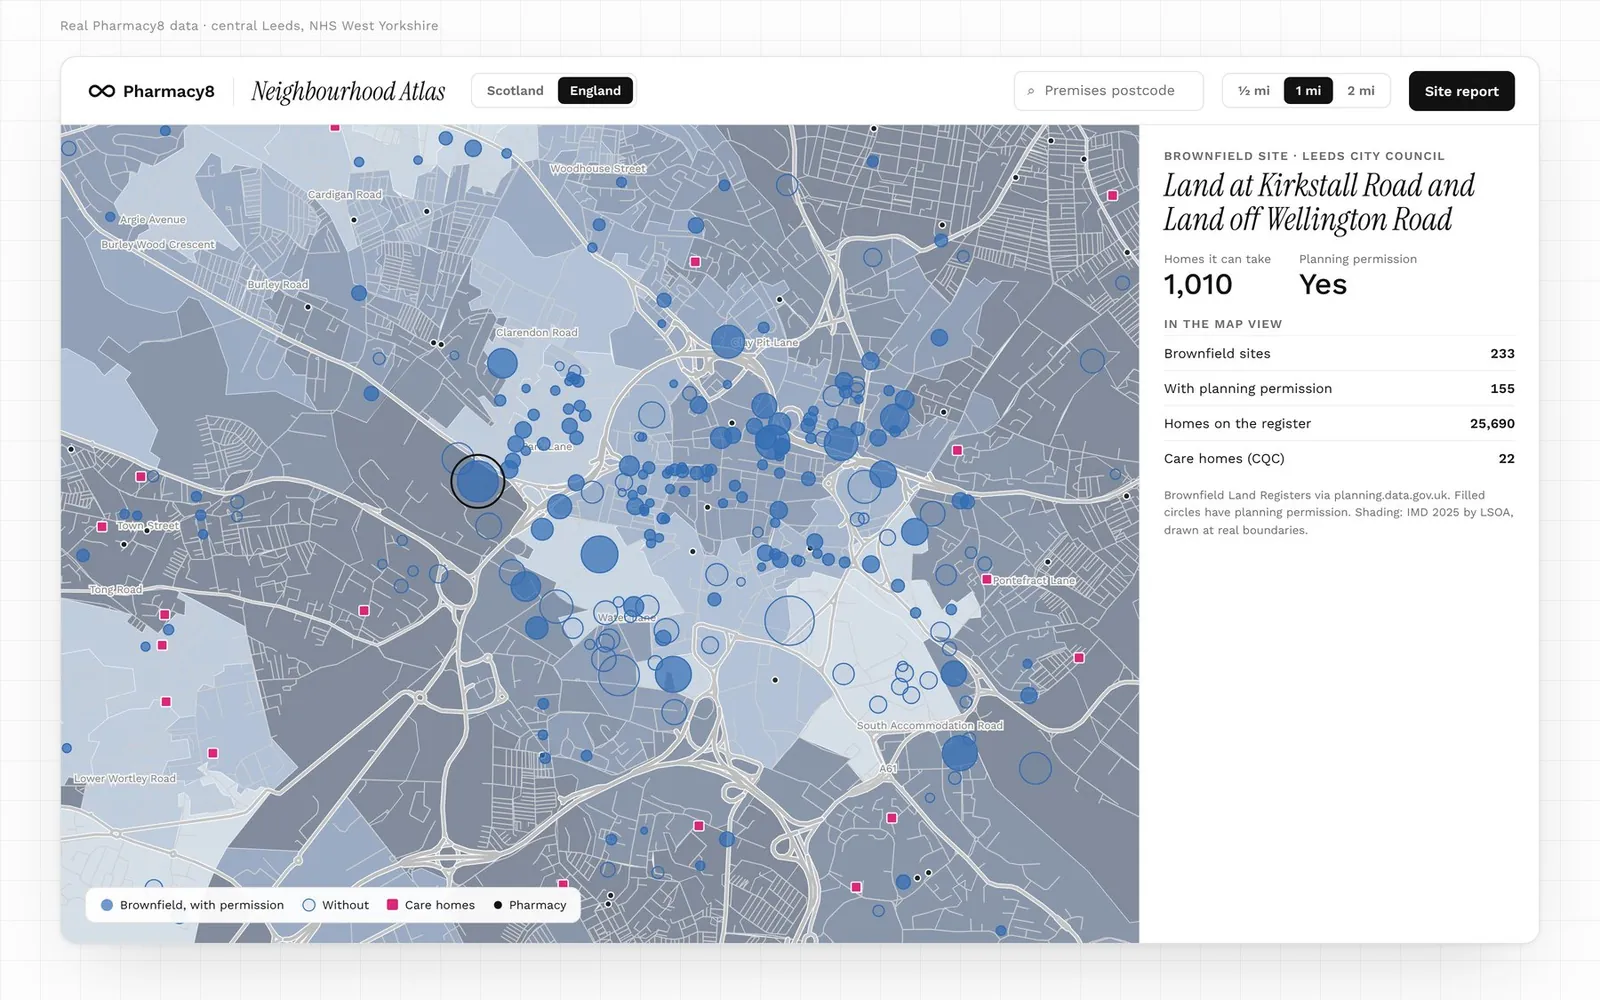
Entries from the councils' Brownfield Land Registers, via planning.data.gov.uk. On the map each is sized by the homes it can take, and filled where planning permission is in place. Compose your map can show the number of sites, the homes on the register, or only the sites with permission.
Care homes
In Scotland, adult care homes from the Care Inspectorate datastore, sized by registered beds; homes for children and young people are left out. In England, residential and nursing homes from the CQC care directory, all drawn one size because the directory states no beds. Compose your map can instead show homes for older people in Scotland, and nursing homes or homes caring for over-65s in England.
Shops and stations
Turn on Shops and stations in Map layers to see where people already go. Supermarkets come from GEOLYTIX Retail Points, drawn larger for bigger stores using GEOLYTIX's size bands. Stations come from the Department for Transport's NaPTAN: rail, metro, tram and subway, and bus and coach stations, one point per station. Rail stations show the Office of Rail and Road's estimate of entries and exits a year where a station could be matched. It covers Scotland, England and Wales.
White space
The White space button in the top bar finds small areas by their figures. Set how far the nearest pharmacy must be, the deprivation deciles, urban or rural, the number of residents, housing or brownfield sites within 2 miles, or a pharmacy that stopped dispensing nearby. Matching areas are ringed in green and listed beside the map. Each area's card gives its published figures, says how new contracts are decided in that nation, and opens a site report centred on it. Nothing is scored or ranked for you: you choose the filters and the order.
Rurality
Each zone's panel gives its urban–rural class: the Scottish Government 6-fold classification (2020) or the ONS Rural Urban Classification (2021). It helps when an area sits on the edge of a town, where distances and expectations change quickly.
Step 5: Check contract activity (Scotland)
In Scotland, the Atlas tracks every published case for a new NHS pharmacy contract. Pharmacy8 reads each health board's publications every month, with appeal outcomes from the National Appeal Panel. England has no contract applications on the Atlas yet.
On the map
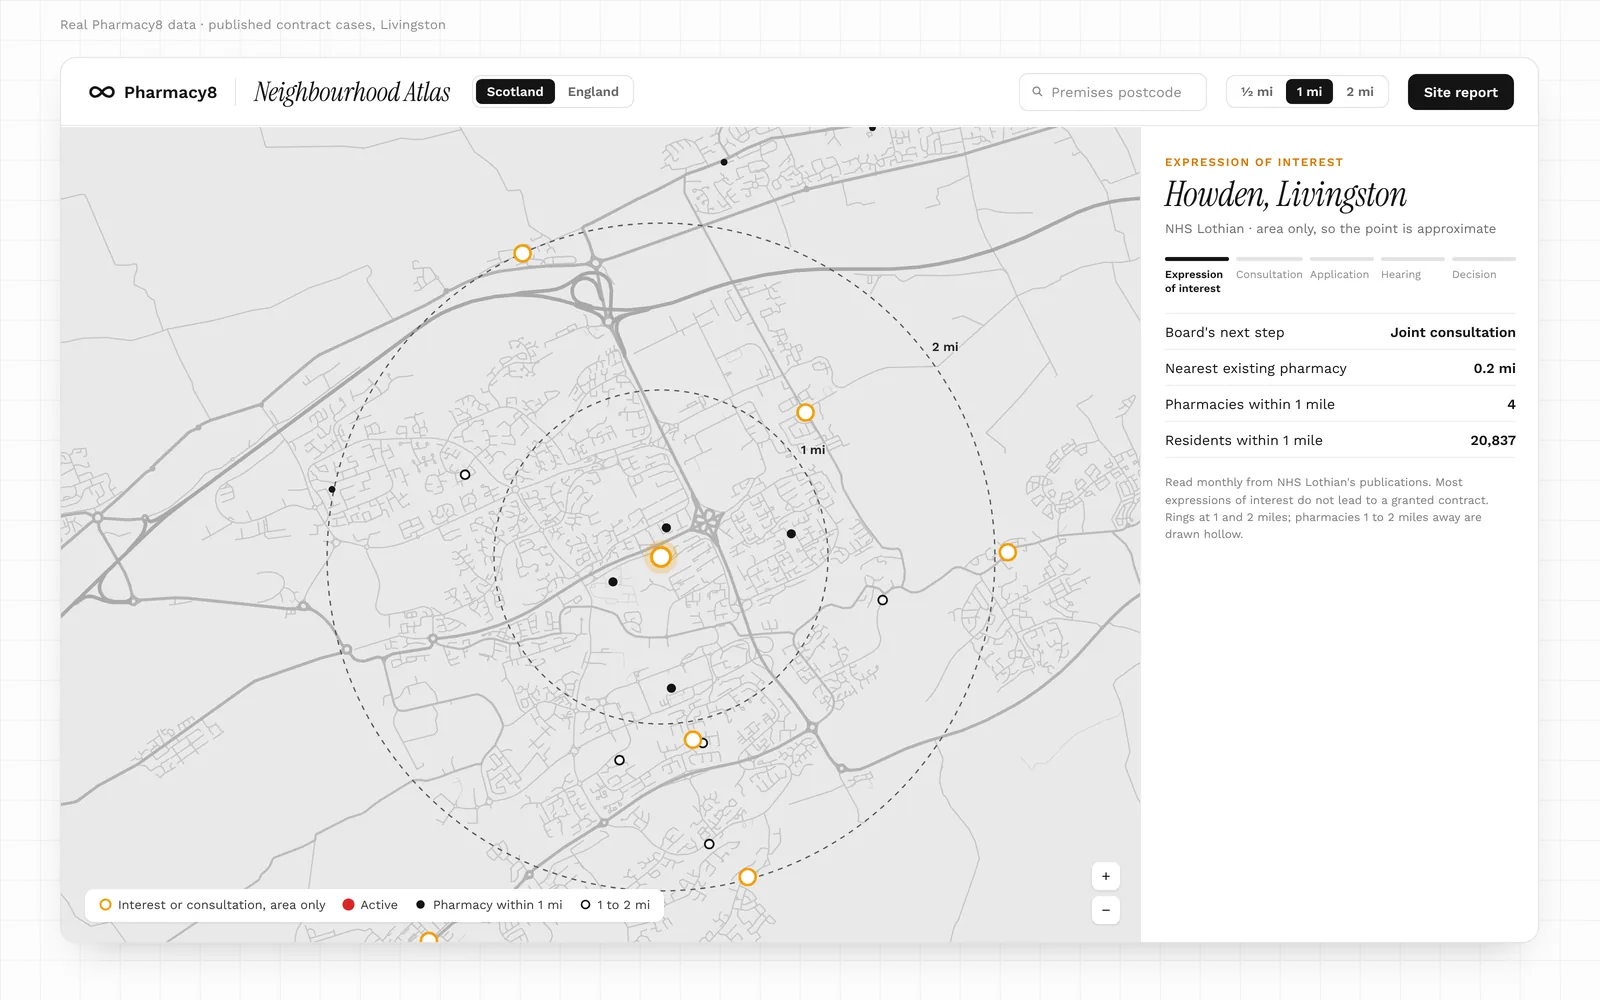
Turn on Contract applications in Map layers. Cases are marked by stage, using shape as well as colour so no stage relies on colour alone.
| Mark | Stage | When it shows on the map |
|---|---|---|
| Large red circle | Active: a formal application, a hearing or an appeal | Always, until decided |
| Small amber circle | Interest or consultation: an expression of interest or a joint public consultation | Always, until it moves on |
| Blue square | Granted | When you switch decisions on |
| Grey square with a cross | Refused or withdrawn | When you switch decisions on |
| Hollow circle | The board published only a town or area, so the point and its distances are approximate | As for its stage |
Decided and withdrawn cases always stay in the register. To see them on the map, tick Show the decisions on the map under Filters, choose the Decided tab, or select a decided case in the register.
Most expressions of interest do not lead to a granted contract, so read the amber marks as early signals.
Select a case for its stage, the board's next step, the nearest existing pharmacies and the residents within a mile. Rings mark 1 and 2 miles; pharmacies within a mile are drawn solid, and those 1 to 2 miles away hollow.
The register
Below the map, the register lists every published expression of interest, consultation, application and decision, one line per case and ten to a page.
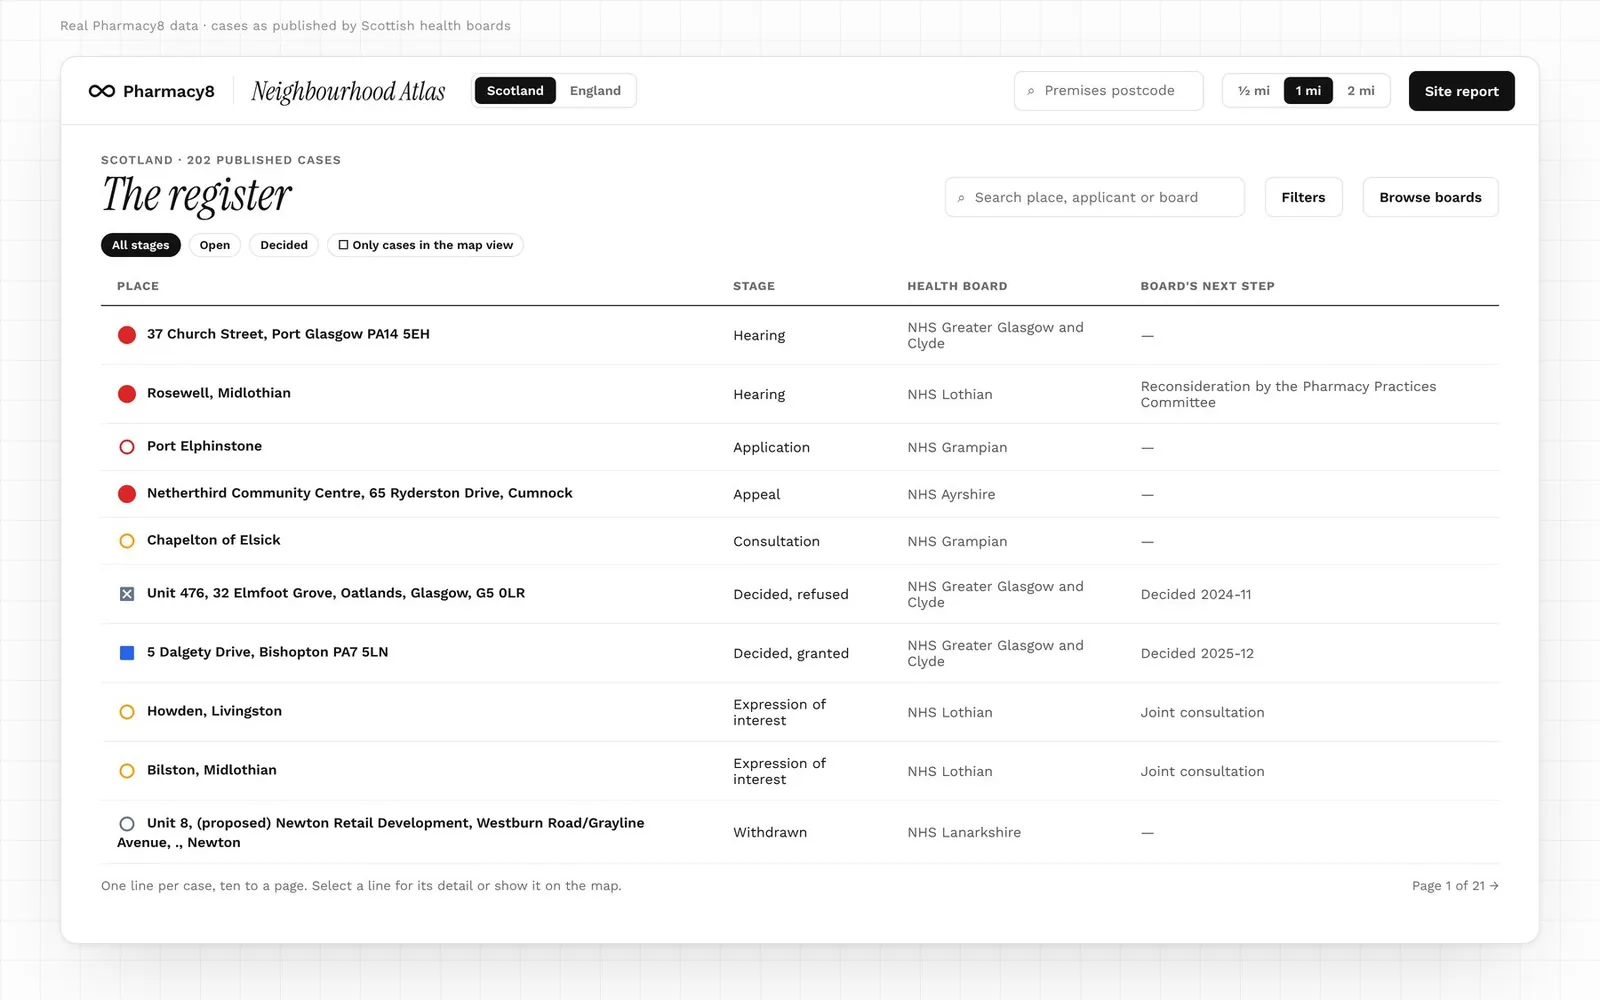
- Search by place, applicant or board.
- Filters narrow the cases by stage, health board or distance from a postcode, and set the register's order.
- Browse boards lists each board's cases.
- Only cases in the map view limits the register to what the map is showing.
- The Cases button opens the cases in view in a panel beside the map. It stays closed until you open it.
Search and filters change the map's markers too. Next steps and dates are each board's own indicative timescales, which change often, and coverage varies by board.
Step 6: Run a site study
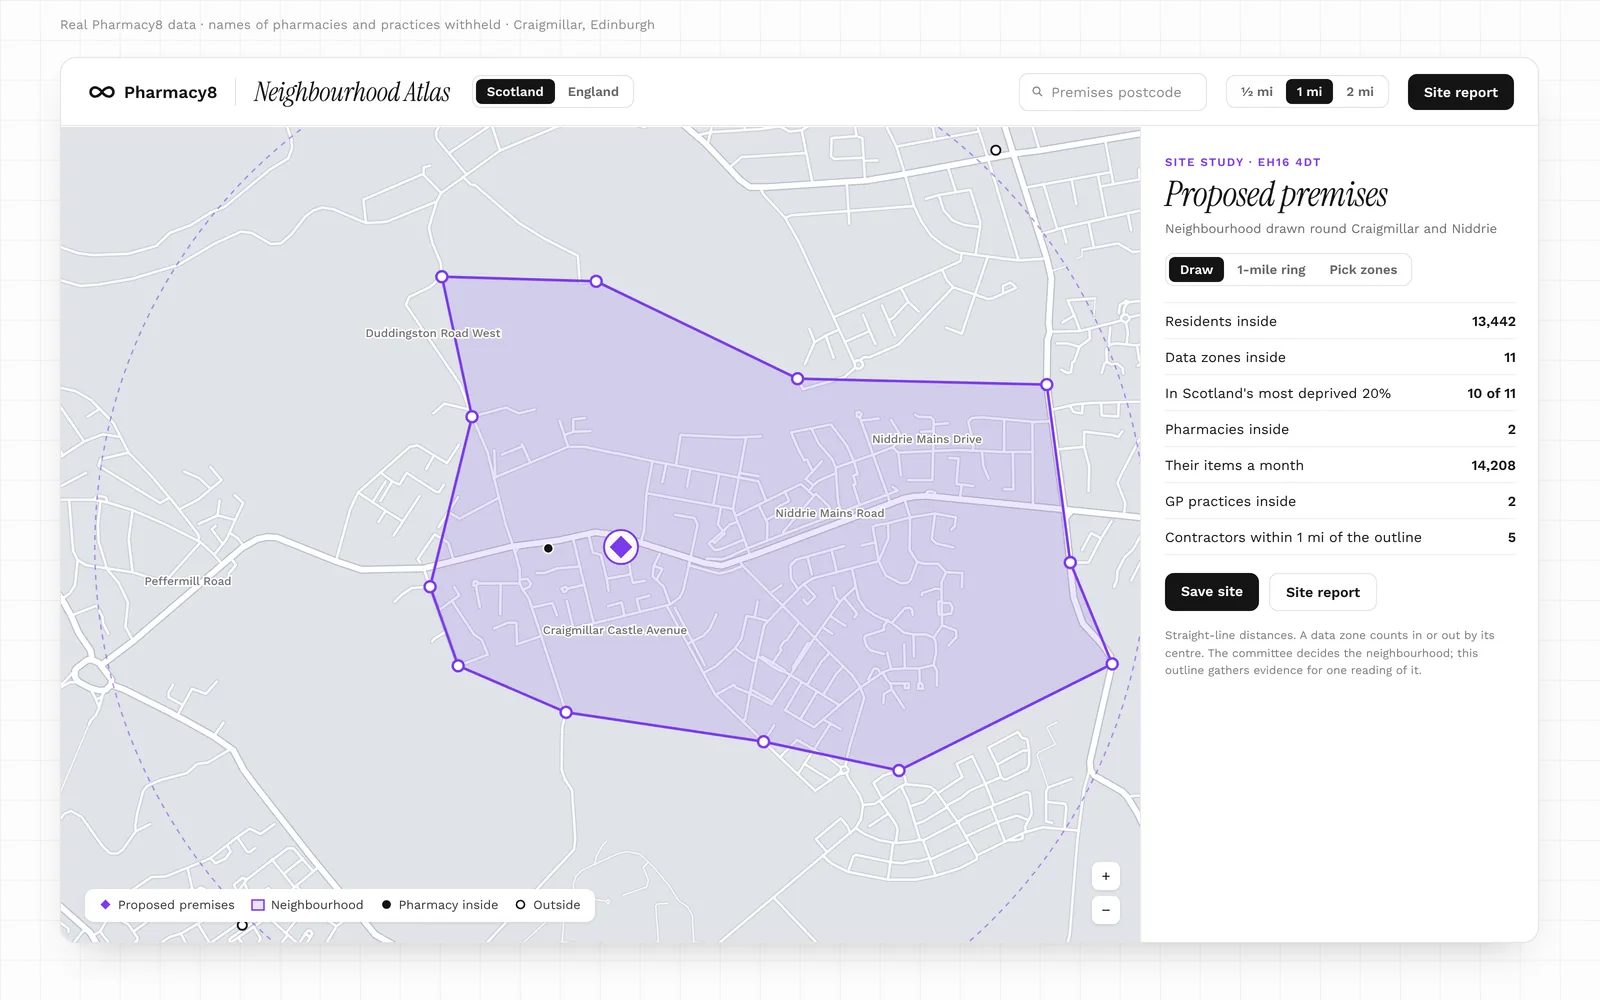
A site study brings every layer together round one proposed premises, inside a neighbourhood you define.
1. Place the premises
Choose Site study, then click the map or enter a postcode. The premises appears as a violet diamond, with rings at 1 and 2 miles. Drag the marker to adjust it; the counts update as you go.
2. Define the neighbourhood
There are three ways to do it:
- Draw it. Click the map at each corner, following the roads, rivers and rail lines that bound the area. Drag any corner to adjust it.
- Start from the 1-mile ring. The ring becomes an outline you can reshape by dragging its corners.
- Pick whole zones. Select the data zones or LSOAs you want inside.
Turn on Streets in Map layers before you draw. It shows motorways and main A roads across the country, B roads as you zoom in, and every public street with its name up close. Private drives, car parks and service roads are left out.
3. Read the evidence
The panel gathers:
- residents and deprivation inside the outline
- the pharmacies inside it, with their items, services and the prescribers they dispense for
- the GP practices inside it, and how much of their prescribing is dispensed there
- the contractors inside it and within a mile of its edge
Tips for drawing
- Follow physical boundaries. Main roads, rivers, railways and open land are what people actually cross, or don't.
- Draw more than one. An outline is one reading of the neighbourhood. In Scotland the committee decides the neighbourhood; in England the ICB decides any application. Comparing a tight and a generous outline shows how much the evidence depends on the line.
- Check the zone edges. A zone counts wholly in or out by its centre, so a line close to a zone's centre can swing its residents in or out.
- Use the worked example. The map guide can load a finished site study to show how one reads.
Step 7: Build the site report
When you want the evidence on paper, use Site report above the map:
- Enter the premises postcode, such as EH16 4DT or LS1 5EY.
- Choose a radius of ½, 1 or 2 miles.
- Select Site report.
You get a print-ready site report for that postcode and radius, which you can download as a PDF. It works for any postcode in Scotland or England. You can also open it from a site study's panel.
Choosing a radius
- ½ mile suits dense town centres, where several pharmacies sit within a few streets.
- 1 mile is the usual starting point for a town or suburb.
- 2 miles suits small towns and rural areas, where the nearest pharmacy may be some way off.
If you are unsure, build the report at two radii and compare them.
What the report contains
| Section | What it covers |
|---|---|
| Summary of figures | The headline figures for the radius on one page |
| The study area | The postcode, its neighbourhood, the radius and a map |
| Residents and deprivation | Residents, older residents and deprivation by zone |
| Pharmaceutical provision | The pharmacies inside the radius, and those within a further mile |
| GP practices and prescribing flows | The practices nearby and where their items are dispensed |
| Housing sites and applications (Scotland) | Planned housing sites nearby and their programmed homes |
| Brownfield sites (England) | Register entries and the homes they can take |
| Rurality, care homes and pharmacy changes | The urban–rural class, care homes and beds, and pharmacies that opened, closed or changed contractor in the last three years |
| Shops and stations | Supermarkets and stations within 200 m, 500 m and 1 km, with store size bands and rail stations' yearly entries and exits |
| Method and limitations | How each figure is measured, and what it cannot tell you |
| Dataset register | Every dataset used, with its publisher, period and licence |
The report states facts only. There are no ratings, flags or conclusions. Every figure names its published source, so it reads the same whoever picks it up.
Step 8: Save and compare sites
Save a site from its report. Saved sites keeps up to 50, and each report is rebuilt from the latest data whenever you open it. To compare, pick two or three and view them side by side.
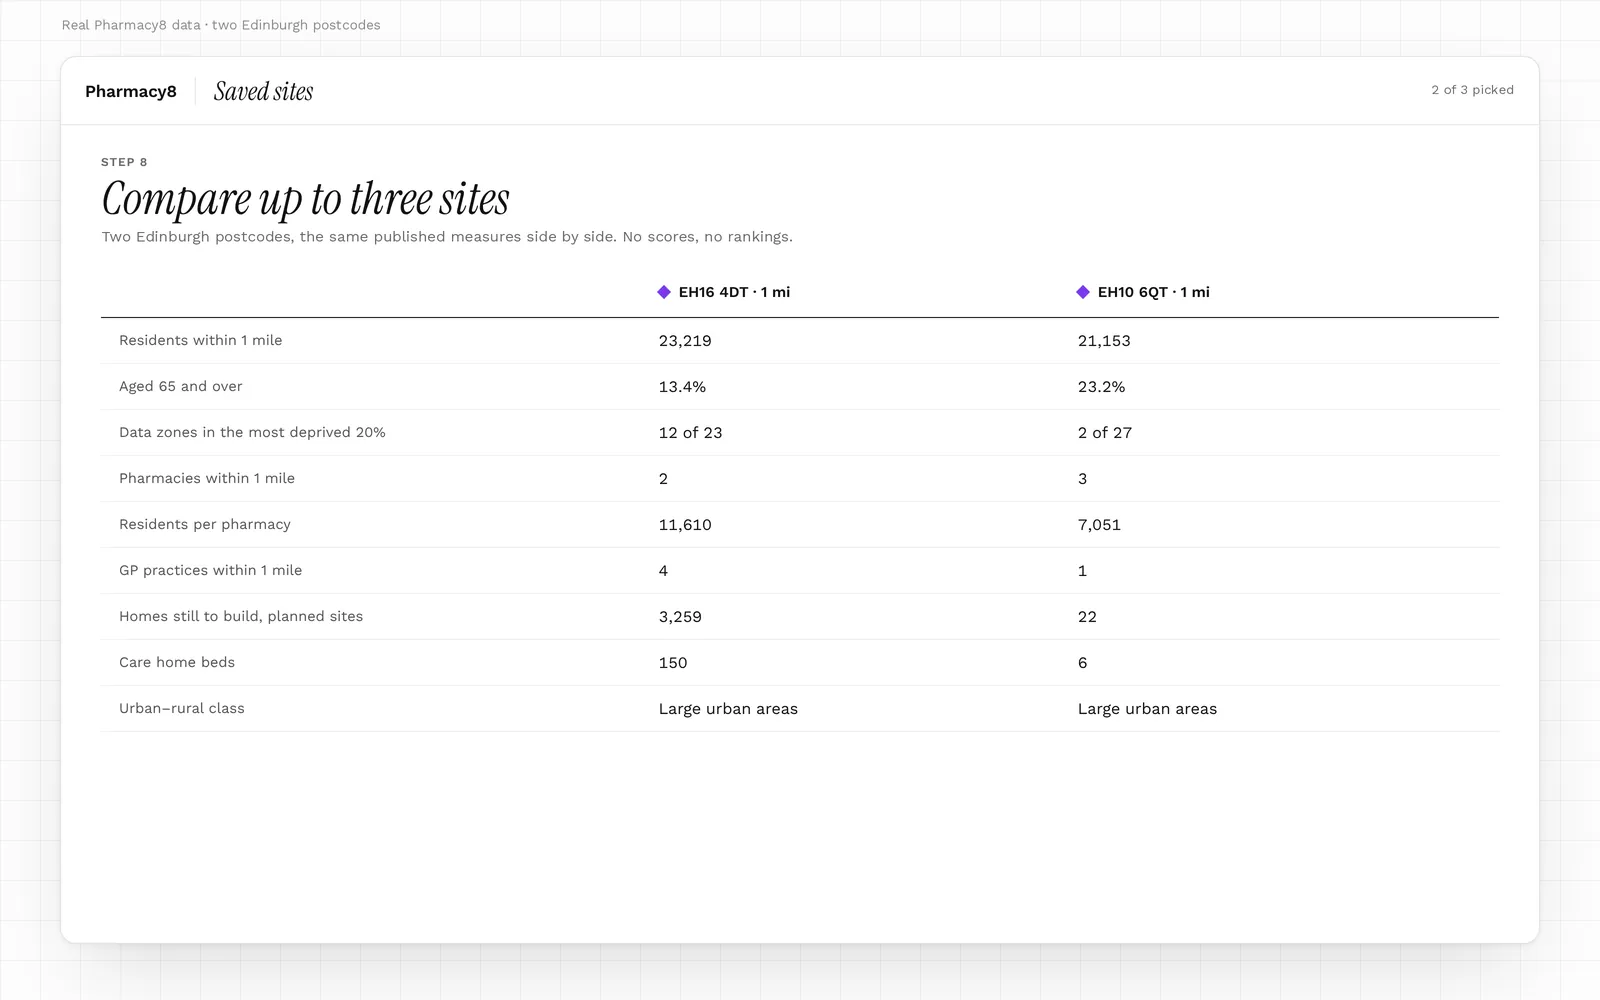
Each column carries the same published measures, so the differences between locations show at a glance. As in the report, nothing is scored or ranked: the comparison sets out the facts and leaves the judgement to you.
Comparison works best when the sites share a radius. A 2-mile site beside a ½-mile site will always look larger.
A worked example: from first look to report
Here is one way to research a site from start to finish. Work through it in order the first time; after that, skip to the steps you need.
- Set the question. Write down what you want to find out, such as whether a growing estate on the edge of town is well served.
- Compose the map with existing pharmacies, deprivation and GP practices on.
- Find the area by postcode. In England, load its ICB and any neighbour within reach.
- Read deprivation by domain, not only overall. Health and access often tell a different story from income.
- Switch to pharmacy access and note the nearest-pharmacy distance and residents per pharmacy.
- Select each nearby GP practice and note how much of its prescribing leaves the area.
- Turn on future demand: planned housing or brownfield sites, and care homes.
- In Scotland, check the register for any open or recent cases nearby.
- Run a site study. Place the premises, turn on Streets, and draw the neighbourhood along its real boundaries. Draw a second, wider outline to test the first.
- Build site reports at 1 mile and at one other radius.
- Save the site, and compare it with up to two others.
- Read the limitations in each report's Method section before you quote a figure.
Before you rely on a figure
The Atlas is indicative market evidence. Keep these limits in mind whenever you quote it, and see Pharmacy8's methodology for how the underlying data is handled:
- Distances are straight lines, not journeys. They understate travel across water, hills and estuaries, and in the Highlands and islands.
- Places are set by postcode. Pharmacies and practices usually sit within a street of the door in towns, and further out in rural areas.
- A zone counts wholly in or out of a ring or outline, by its centre.
- Zoomed-out hexagons are a summary. Large rural zones reach well beyond their hexagon; select one to see its zones at full extent.
- Patients do not all live near their practice, so prescribing distances describe the practice, not its patients' homes.
- Publication dates differ. In Scotland, dispensing items run about a month ahead of services, and prescriber links cover the GP layer's 12 months.
- Population bases differ by nation. Scotland uses the latest National Records of Scotland estimates. England uses the IMD 2025 denominators (ONS mid-2022), with older residents counted from 60.
- Deprivation editions differ. Scotland remains on SIMD 2020v2 until SIMD 2026 is published; England uses IMD 2025.
- Coverage is not identical. England has no planned housing or contract applications on the Atlas yet; Scotland has no brownfield layer.
- Housing programmes are forecasts. Councils' programmed completions are not commitments.
- Distance-selling pharmacies are left out of the map and every count.
Glossary
| Term | Meaning |
|---|---|
| Data zone | Scotland's small statistical area, home to roughly 500 to 1,000 people |
| LSOA | Lower layer super output area: England's small statistical area, about 1,500 people |
| ICB | Integrated care board: the NHS body for an area of England, and the decision-maker on pharmacy applications |
| SIMD / IMD | Scottish Index of Multiple Deprivation (2020v2 edition) / English Indices of Deprivation (2025 edition) |
| Decile | One tenth of all areas, ranked. Decile 1 is the most deprived tenth |
| Domain | One side of deprivation, such as income, health or access |
| IDACI / IDAOPI | England's income deprivation indices for children and for older people |
| Dispensing practice | A GP practice that dispenses medicines to some of its own patients |
| Distance-selling pharmacy | A pharmacy that serves patients remotely; left out of the Atlas |
| Prescribing flow | Where a practice's prescription items are dispensed |
| Neighbourhood | Scotland: the area round a premises that an application is judged against |
| Site study | A premises placed on the map with a neighbourhood drawn round it |
| Housing land audit | A council's yearly record of housing sites and expected completions |
| Brownfield Land Register | A council's list of previously developed land suitable for housing |
| Urban–rural class | How urban or rural an area is, on each nation's official scale |
More pharmacy data terms are explained in the Pharmacy8 glossary.
Frequently asked questions
Does the Atlas tell me whether a site will be granted?
No. It sets out the published evidence and makes no prediction. In Scotland the committee decides the neighbourhood and the outcome; in England, the ICB decides any application.
Can I use the Atlas for a pharmacy contract application?
Yes, as a source of evidence. Much of what an application or a response to one draws on is here: the neighbourhood, its residents and deprivation, the pharmacies already serving it, how far people travel, where local prescriptions are dispensed and the housing planned nearby. The site report sets it out with a source for every figure. In Scotland, the health board's Pharmacy Practices Committee decides whether existing services in the neighbourhood are adequate and, if not, whether a new pharmacy is necessary or desirable. In England, the ICB judges an application against the local Pharmaceutical Needs Assessment. The Atlas gives evidence for either, but makes neither judgement.
Can I compare a Scottish area with an English one?
You can view both, but deprivation deciles are ranked within each nation, and population bases differ. Compare like with like within a nation.
Why is a pharmacy I know missing?
The map shows community pharmacies that dispensed in the latest three published months. Distance-selling and appliance contractors are left out, and a new pharmacy appears once its first dispensing month is published.
Why does a pharmacy appear in the wrong spot?
Pharmacies are placed by postcode, so a dot may sit a street away from the door, or further in rural areas.
How current is the data?
Each layer follows its publisher's schedule: monthly for dispensing, quarterly or monthly for list sizes and prescribing links, and yearly for housing audits. Each site report's dataset register gives the exact period for every source.
Does it cover Wales and Northern Ireland?
Wales is covered, with its own health boards, the Welsh Index of Multiple Deprivation 2025 and NWSSP's dispensing and prescribing data. Northern Ireland is covered too, loaded by its 11 council areas, with the Northern Ireland Multiple Deprivation Measure 2017 (still the latest), Census 2021 Data Zones and BSO's dispensing and prescribing data. Northern Ireland has no streets layer and no service counts, as BSO publishes none.
Can I share what I find?
Yes. Download a site report as a PDF, or share a link that opens the map on a nation or ICB.
Explore it yourself
Neighbourhood Atlas is included with Octo, from £4.99 a month, alongside every pharmacy's dispensing trend, its GP feeder surgeries and nearby competitors. When a colleague you invite subscribes, your next month is free. Open the Atlas, take the Full tour, and start with a postcode you know well.
Sources
- 1.Public Health Scotland, Prescriptions in the Community
- 2.Public Health Scotland, Prescribed and Dispensed: GP practice to dispenser
- 3.Public Health Scotland, Community Pharmacy Contractor Activity
- 4.Public Health Scotland, GP Practice Populations
- 5.Public Health Scotland, GP Practice Contact Details and List Sizes
- 6.Public Health Scotland, Scottish Government Urban Rural Classification 2020
- 7.Scottish Government, Scottish Index of Multiple Deprivation 2020v2
- 8.Scottish Government, Data Zone Boundaries 2011
- 9.National Records of Scotland, Small Area Population Estimates
- 10.Improvement Service Spatial Hub, Housing Land Supply (under licence)
- 11.Care Inspectorate, Care Services Open Datastore
- 12.NHS Scotland health boards, Pharmacy contract applications (for example, NHS Lothian)
- 13.NHSBSA, Pharmacy and Appliance Contractor Dispensing Data
- 14.NHSBSA, English Prescribing Dataset
- 15.NHS England, Patients Registered at a GP Practice
- 16.NHS England, Organisation Data Service (epraccur)
- 17.MHCLG, English Indices of Deprivation 2025, with population denominators (ONS mid-2022)
- 18.ONS, LSOA (2021) and ICB boundaries
- 19.ONS, Rural Urban Classification 2021
- 20.English councils via planning.data.gov.uk, Brownfield Land Registers
- 21.Care Quality Commission, Care directory
- 22.ONS via postcodes.io, ONS Postcode Directory
- 23.Ordnance Survey, OS Open Roads
Written by Octo, Pharmacy8's AI analyst, from the sources above and checked by a registered pharmacist before publication. Figures marked “Pharmacy8 data” are Pharmacy8's own analysis of the published datasets. Pharmacy8 is not affiliated with the publishers cited.